
Cost Comparison Spreadsheet: Track Per-Items Prices and Cut Your Monthly Spend

Key Takeaways
- A cost comparison spreadsheet tracks per-unit price across stores. It exposes the small overpayments that quietly inflate your monthly grocery bill.
- The value is in cost per ounce or per count, not the sticker price that usually misleads you.
- A bigger box or a sale tag isn't always cheaper. The unit-price column tells you the truth.
- Setup runs 30 to 60 minutes for your first 20 to 30 regular items.
- Maintenance is about two minutes of price updates per receipt.
- Free Google Sheets or Excel handles the whole thing. No special software. Just a blank sheet and your last few receipts.
- Ready-made templates from Vertex42 and Smartsheet give you a starting point if you'd rather not build from scratch.
Quick Summary
A cost comparison spreadsheet tracks the per-unit price of items across multiple retailers, so you buy at the real low point instead of the loudest sale tag. Build one and you start killing the small overpayments that hide in plain sight. The ones that quietly inflate your monthly spend.
The work is simple. You log what you buy, where, and the cost per ounce or per count. Then you stop guessing.
What the spreadsheet actually tracks
It tracks cost per volume, not the sticker price. That's the whole trick. A bigger box isn't always cheaper, and a "sale" often isn't.
The 20somethingfinance grocery price list method builds the sheet around price per ounce or per unit, so you compare a 12-oz jar against a 24-oz one honestly. That single column is usually where the biggest overpayments surface.
Five columns get you started: item name, store, package size, total price, unit price. Sort by that last column and your cheapest source for each item becomes obvious.
How much time this takes
Setup runs about 30 to 60 minutes for your first 20 to 30 regular items. After that, two minutes per receipt.
The free Google Sheets or Excel approach needs no special software. A blank sheet and your last few receipts get you started.
Prefer not to build from scratch? The Vertex42 grocery price book and the Smartsheet price comparison templates hand you the structure for free.
Where the savings come from
Three places: spotting the true unit-price winner, dropping items where the "deal" loses, and trimming your list to what you actually use. Shoppers who use unit pricing consistently buy more efficiently, a pattern documented in research on unit pricing usage.
The manual sheet is great for your 20 to 30 core staples. But updating prices across eight retailers by hand gets tedious fast. That's where automation helps. Our AI agent at Popgot reads labels and pulls the real unit price across major retailers in one search, which removes the data-entry slog the spreadsheet method depends on.
Skip the spreadsheet if you buy fewer than a dozen repeat items. The setup time won't pay back. The method earns its keep when you have a long, repeating list of staples you rebuy month after month.
Start with your 10 most-bought items this week. Log their unit prices, find the cheapest source, and you'll feel the first cut on your next grocery run.
What I'd actually do first
A cost comparison spreadsheet pays for itself fast. Track per-unit prices across a few stores, and you stop overpaying on the items you buy every week. Most shoppers cut $100 to $200 a month once they shop by cost per ounce instead of sticker price.
That's not a one-time win. It compounds every grocery run, every household-goods restock, every time you'd otherwise grab the "deal" that wasn't.
The one rule that runs the whole system
Compare cost per volume, not the price on the shelf. A 48-ounce jar isn't cheaper than two 24-ounce jars unless the math says so. The grocery price list method builds your sheet around this single number.
Three things stack up once you commit:
- You buy at the real low point. Logged prices show your true floor, so a "sale" tag can't fool you.
- You stop guessing. Every purchase becomes a quick lookup instead of a gamble.
- Small overpayments die off. The 30-cent gaps you never noticed add up across dozens of items.
How to get started
Start small with five to ten items you buy most often. Milk, eggs, coffee, paper towels, your kid's cereal. Log the store, the size, and the cost per ounce or per unit each time you shop. Within a few trips, patterns appear.
Build it in free Google Sheets or Excel. Add a column for cost per volume and let the formula do the comparison. Sort by lowest price to spot which store wins for each item.
Customize as you go. Add a "best price seen" column to set your buy threshold. Add notes for bulk-only deals or seasonal swings. If you manage spending beyond groceries, a cost comparison template guide shows how the same per-unit logic applies to vendors and recurring purchases.
Can you skip the manual work?
Yes, if logging prices by hand feels like a chore. An AI-driven shopping platform can track per-item prices for you and surface the cheapest option automatically, which removes the part that makes most people quit after two weeks.
The trade-off is real. A manual sheet costs you nothing but time and gives you full control over what you track. An automated tool saves the effort but ties you to its data. Pick based on how disciplined you are about updating a spreadsheet. If you've abandoned tracking projects before, automation keeps the habit alive.
Start this week
Open a blank sheet today. Pick your top ten items, log them on your next shopping trip, add a cost-per-unit column. That's the entire setup.
The savings show up faster than you'd expect. By your third or fourth trip, you'll catch overpayments you'd have missed and steer your cart toward the real low prices. $100 to $200 a month is sitting in plain sight. Build the sheet and go take it.
Why this isn't just penny-pinching
Most shoppers already compare prices. A National Retail Federation study found 75% of consumers check prices before they buy. The problem is they compare the wrong number. They look at the sticker, not the cost per unit, and that gap is where the overspending lives.
A cost comparison spreadsheet closes that gap. It turns price-checking from a gut feeling into math you can trust.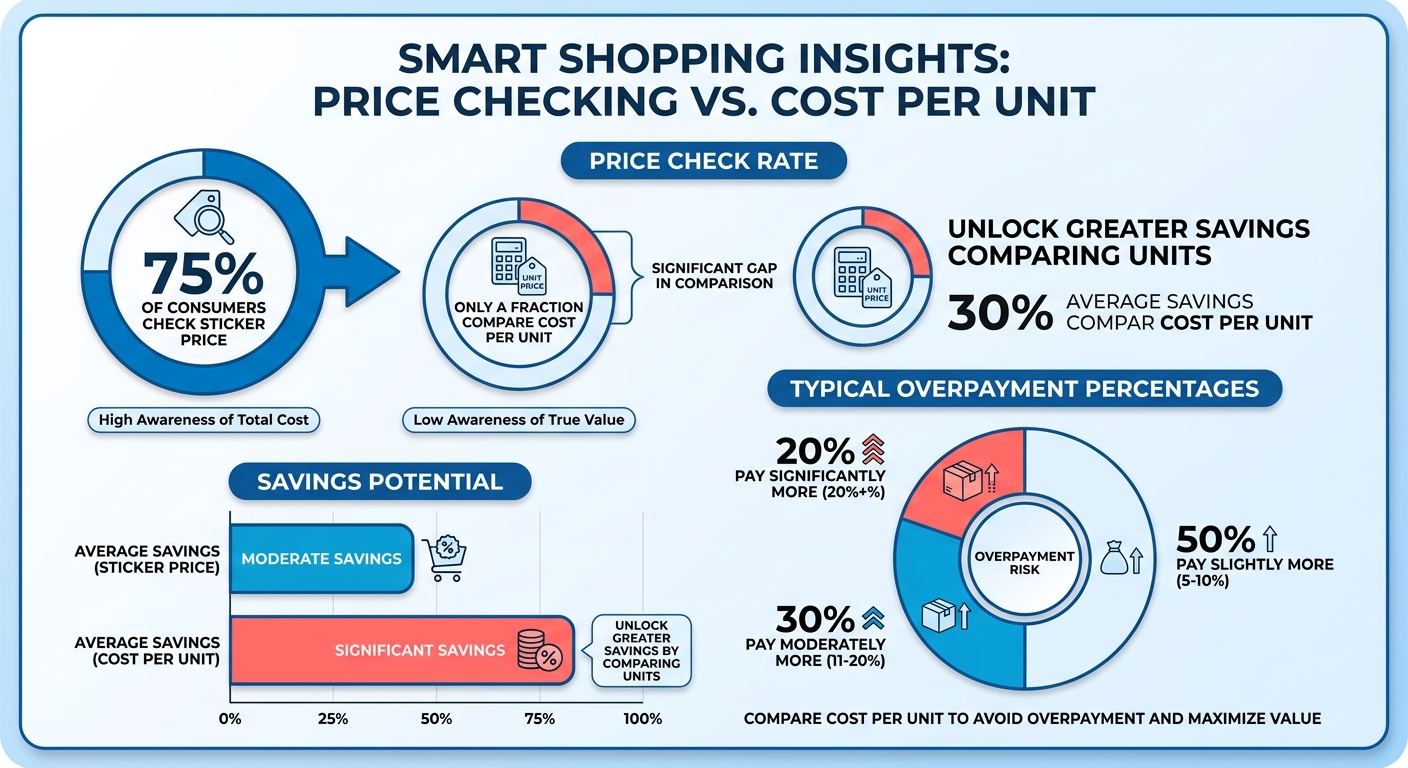
How much can you actually save?
A cost comparison spreadsheet cuts monthly spend by 10 to 20% for most households. The savings come from catching price discrepancies you'd otherwise miss and rebuilding your list around the real low points instead of the loudest sale tags.
The reason it works is unit pricing. The research on consumer awareness of unit pricing points to a real friction point: people want to compare value but struggle to do it standing in the aisle. The spreadsheet does the comparison for you, ahead of time.
A bulk warehouse pack often looks like the obvious win until you run the math. A multi-pack of paper towels priced at $24 can cost more per sheet than a smaller four-roll pack on promotion. The sheet surfaces that reversal before you commit.
What problems it solves
Two specific ones: hidden price discrepancies and bloated shopping lists.
Price discrepancies hide everywhere. The same brand of pasta sauce can swing 40 cents per ounce between two stores a mile apart. Without a log, you never see it. With one, the cheaper store shows up in plain numbers, and you route your buys accordingly using the Google Sheets grocery price list approach.
The second fix is list optimization. Once you track cost per ounce, your shopping list reorganizes itself around the items that move the needle. You stop overpaying on staples you buy every week.
Who gets the most out of it
Health-conscious shoppers and parents. Both buy the same items on repeat, which is exactly where per-unit tracking pays off.
Health-conscious shoppers buy specialty items like protein, produce, and pantry staples at premium prices. Tracking cost per unit keeps those repeat purchases from quietly draining the budget.
Parents restock the same diapers, snacks, and household goods constantly. Small per-unit differences add up fast across a family-sized cart. A family of five logged their regular buys across three stores for a month. They found that bulk packaging on half their staples wasn't actually cheaper per ounce, shifted those items to the store with the real low price, and trimmed $500 a month off their grocery and household spend.
That's not a fluke. It's the predictable result of comparing the right number. The same logic scales beyond groceries to any recurring purchase, which is why a structured cost comparison template helps once you move past the kitchen.
Automating data entry and updates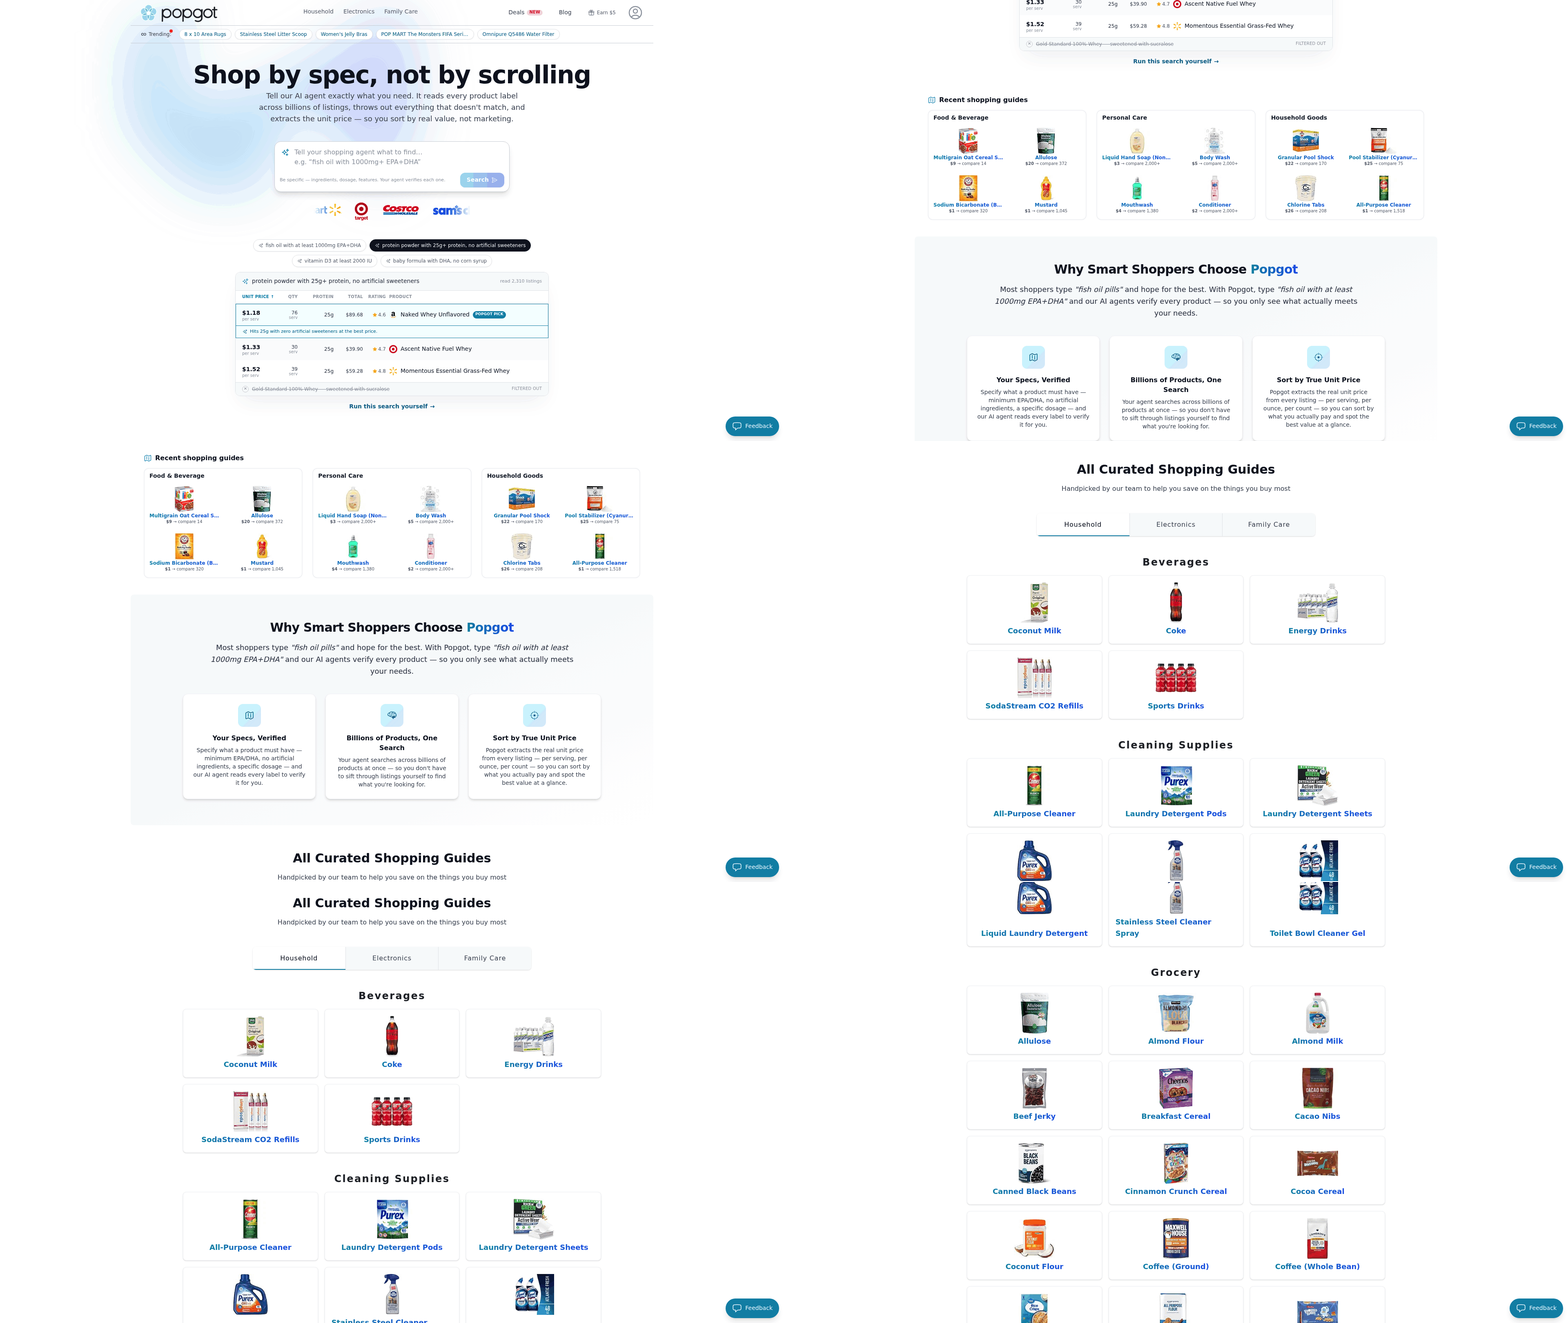
Manual data entry kills most cost comparison spreadsheets. You build the sheet, log prices for two weeks, then life gets busy and the data goes stale. AI-driven shopping platforms pull current prices into your sheet automatically, so the numbers stay accurate without you typing a single cell.
How to automate price entry
The fastest way to keep a price book current is to connect it to a tool that updates prices on its own. Instead of typing each store's cost per ounce by hand, an AI shopping platform pulls live retailer prices and feeds them straight into your comparison view.
Free templates already handle the math. The Vertex42 grocery price book works with mobile Excel apps, so you can edit on the go. The Smartsheet templates let you view pricing for multiple vendors in one sheet.
Automation builds on that foundation. The template holds your item names and unit-price formulas. The platform refreshes the price column so the low-point math recalculates every time a retailer changes a tag.
Can you compare retailers automatically?
Yes. A multi-retailer search checks the same item across several stores at once and returns the price for each. Drop those numbers into your spreadsheet, and the per-unit column tells you where the real low point sits.
Say you search a 64-ounce laundry detergent across four retailers. One shows $11.99, another $9.49, two more land in between. The cost-per-ounce calculation flags the $9.49 option instantly, even though a different store ran a louder "sale" banner. You stop guessing which store wins this week.
How to set up price alerts
Set alerts for two triggers: a price drop on an item you buy often, and an overage when a store creeps above your tracked low point. The alert pushes a notification, you adjust your list, and you never pay the inflated number by accident.
Think of it as a watchlist for your grocery run. Tag the 12 items you restock monthly. When the detergent drops below your logged average, you get pinged and time the buy.
The same works in reverse. If your usual store quietly raises a price past your benchmark, the overage alert tells you to source it elsewhere this trip.
What automation actually saves you
The biggest payoff is time. Shoppers who automate data entry and updates save 2 to 3 hours per week they'd otherwise spend logging prices and checking flyers by hand. Three hours a week is roughly 12 hours a month back, on top of the dollar savings from buying at the real low point.
For a small business, the math scales harder. A household-goods reseller restocking weekly across multiple suppliers can cut manual entry from hours to minutes per cycle, freeing staff to handle orders instead of copy-pasting vendor quotes. If you run a recurring restock, the Wrike cost comparison guide shows how the same structure applies to vendor analysis beyond groceries.
Reading the sheet to find where money leaks
Your spreadsheet only saves money once you read it. The data in those cells points to exactly where your spending leaks. Sort by price gaps, watch how costs move over time, and you turn a static price list into a tool that tells you what to buy and where.
How to spot price discrepancies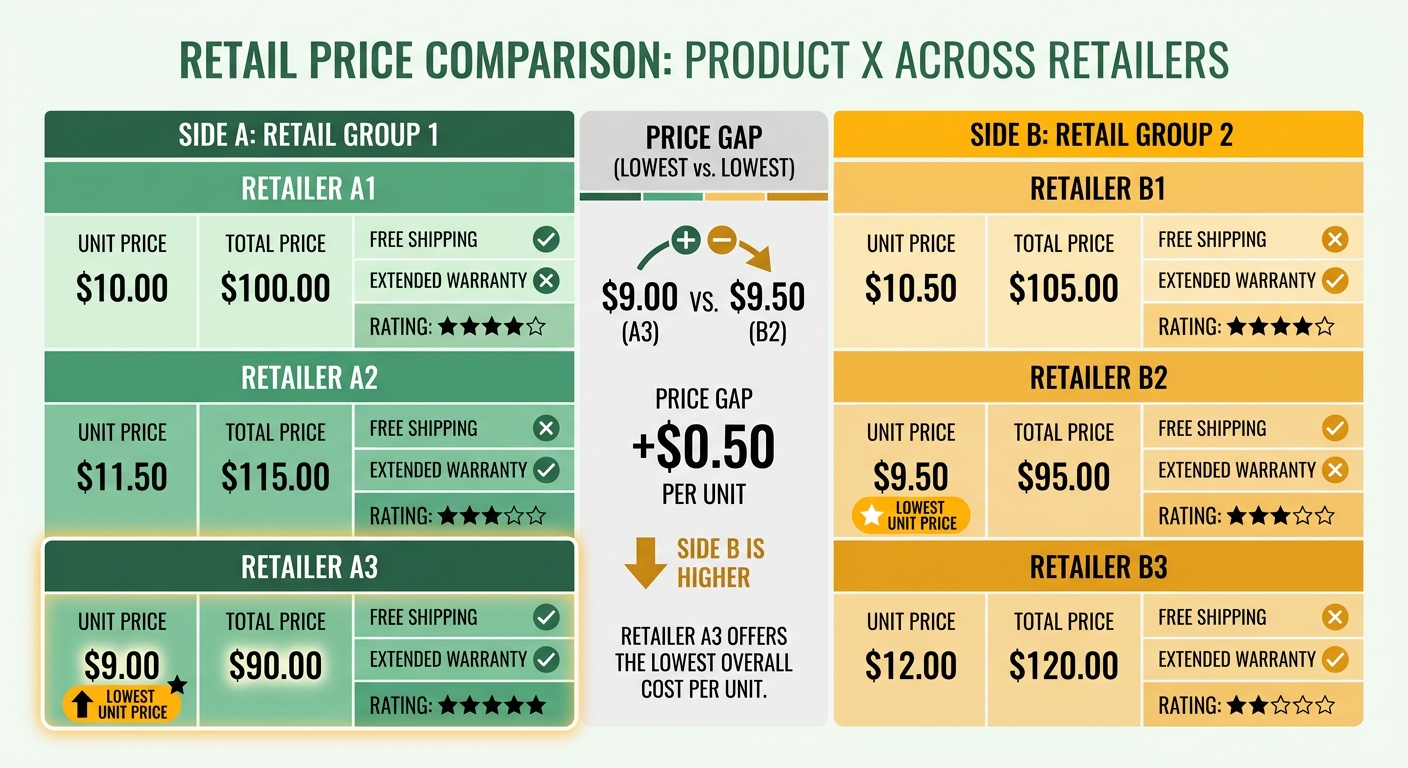
The fastest cost cut comes from finding the same item priced differently across stores. A price comparison template puts multiple vendors in one view, so the gaps jump out instead of hiding across separate receipts.
Sort by cost per ounce, not sticker price. That single move exposes the items where one store quietly charges more for the same product.
The grocery price list method builds the whole sheet around cost per volume for this reason. A name-brand cereal at one store might lose to a store brand by a wide margin once you check the per-ounce number. Those gaps are your shopping list.
Can you forecast future costs from the data?
Yes. Once you log prices over several weeks, patterns emerge. You start seeing which items swing on sale cycles and which hold steady, so you can time purchases instead of buying on impulse.
This matters because unit pricing is hard to use in the moment. Your spreadsheet does the math ahead of time, so the comparison is already settled when you're standing in the store.
Track a staple like olive oil across two months. If the per-ounce price dips every few weeks, you stock up at the low point and skip the inflated weeks entirely.
Where to find budget swaps
Curated shopping guides surface lower-cost alternatives you already wanted to find. Instead of scanning every shelf, you pull from a list of vetted budget-friendly swaps and drop them into your comparison sheet to confirm the savings.
A household paying a premium for a branded pantry staple finds a curated guide flagging a cheaper equivalent. They add both to the sheet, compare cost per unit, and the swap pays off every restock after that.
This is where savings stack. A single swap on a weekly staple might save only a dollar or two per trip, but multiply that across a full cart of vetted alternatives and the gap compounds fast. The number holds because the swaps repeat. You don't find the deal once. You find it every week, on every item you logged.
The pattern is simple. Identify the gap, forecast the low point, swap to the cheaper equivalent. A vendor cost analysis guide applies the same logic to bigger purchases, but the principle holds for groceries too: let the data pick the winner, not the sale tag.
Building the spreadsheet
Three moves: gather your prices, set up the columns, then let the math do the work. You can do all of it for free, and the whole structure rests on one calculated column: cost per unit.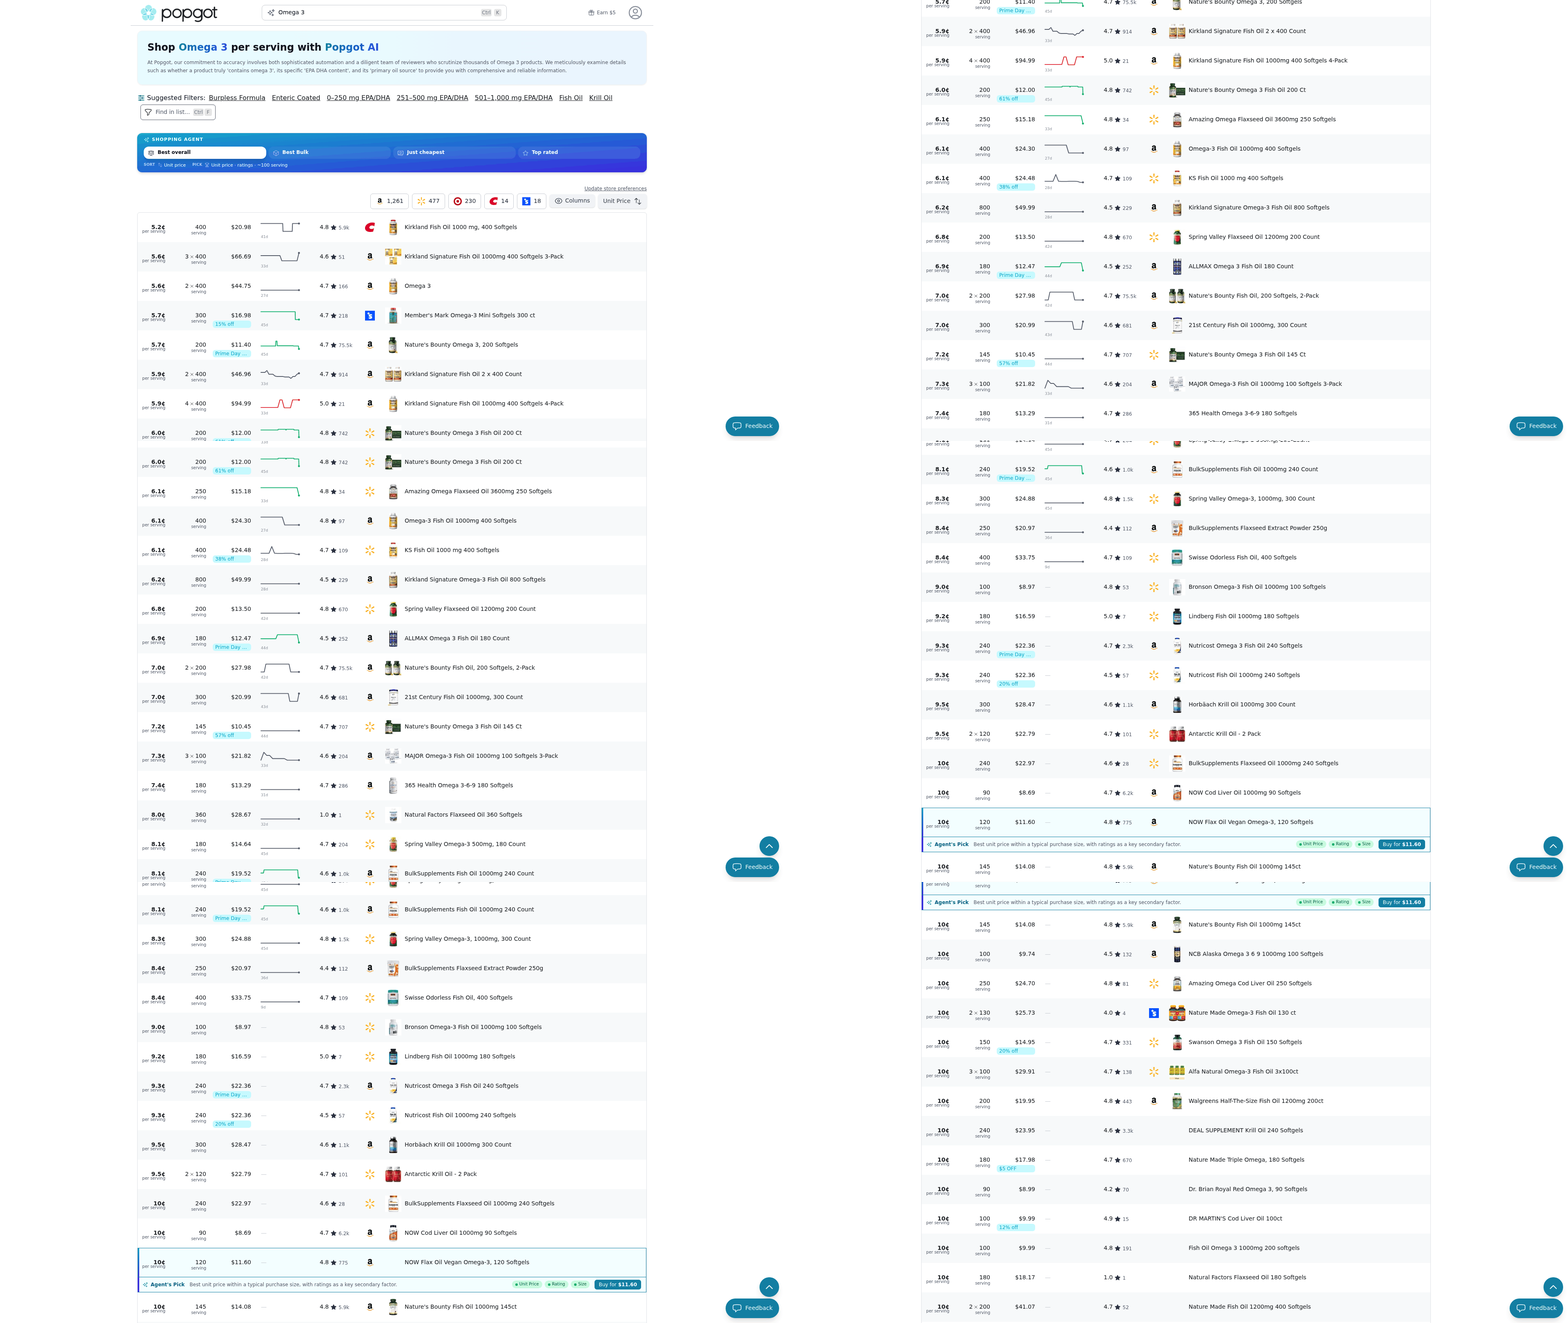
Gathering your prices
List the items you actually buy, then log their prices across two or three stores. The grocery price list method builds this around cost per volume, so you record the package size next to the price for each retailer.
Keep your first list short. Pull 20 to 30 staples from your last few receipts. Those repeat purchases are where the savings stack up, since you buy them again and again.
For each item, write down four things: product name, store, package size, price. That's enough to calculate the number that matters.
Building and customizing the sheet
Set up columns for item, store, size, price, and a formula column for cost per unit. The price comparison template holds your pricing so you compare retailers side by side instead of flipping between receipts.
The unit cost formula is simple. Divide price by package size. A $4.50 bottle holding 30 ounces costs $0.15 per ounce. Put that division in a formula cell so it recalculates every time you update a price.
Watch your units. Mixing ounces with pounds or count with weight produces numbers that look right but compare nothing. Add a units column next to size so every row states whether it's measured in ounces, grams, or each, and the division stays honest.
Want to go past groceries? A vendor cost analysis template extends the same structure to household goods and supplies. The columns stay the same. Only the items change.
Tracking stock and spotting cuts
Add a beginning inventory column and a stock-level count, then check them before each shopping trip. This stops you from buying what you already have and tells you exactly what's running low.
The point of all this is the comparison. Once your cost-per-unit column is filled, sort by it. The store charging $0.15 per ounce beats the one charging $0.22, even if the second has a bigger "sale" sticker.
For higher-volume buying, add a pour cost column. Divide the cost of one serving by the price you'd charge or budget for it. That ratio flags items where the per-serving cost runs high and points you toward cheaper substitutes or different package sizes.
Keep it simple at first. Five columns and one formula beat a complicated sheet you abandon after a week.
Optimizing your list and cutting waste
Your spreadsheet doesn't just tell you where to buy. It tells you what to buy, and what to stop buying. Once you know the real per-unit cost of every staple, you can rebuild your list around the cheapest version of each item and cut the waste that comes from buying too much of the wrong thing.
The shift is simple but powerful: your list stops being a habit and becomes a set of deliberate, math-backed choices.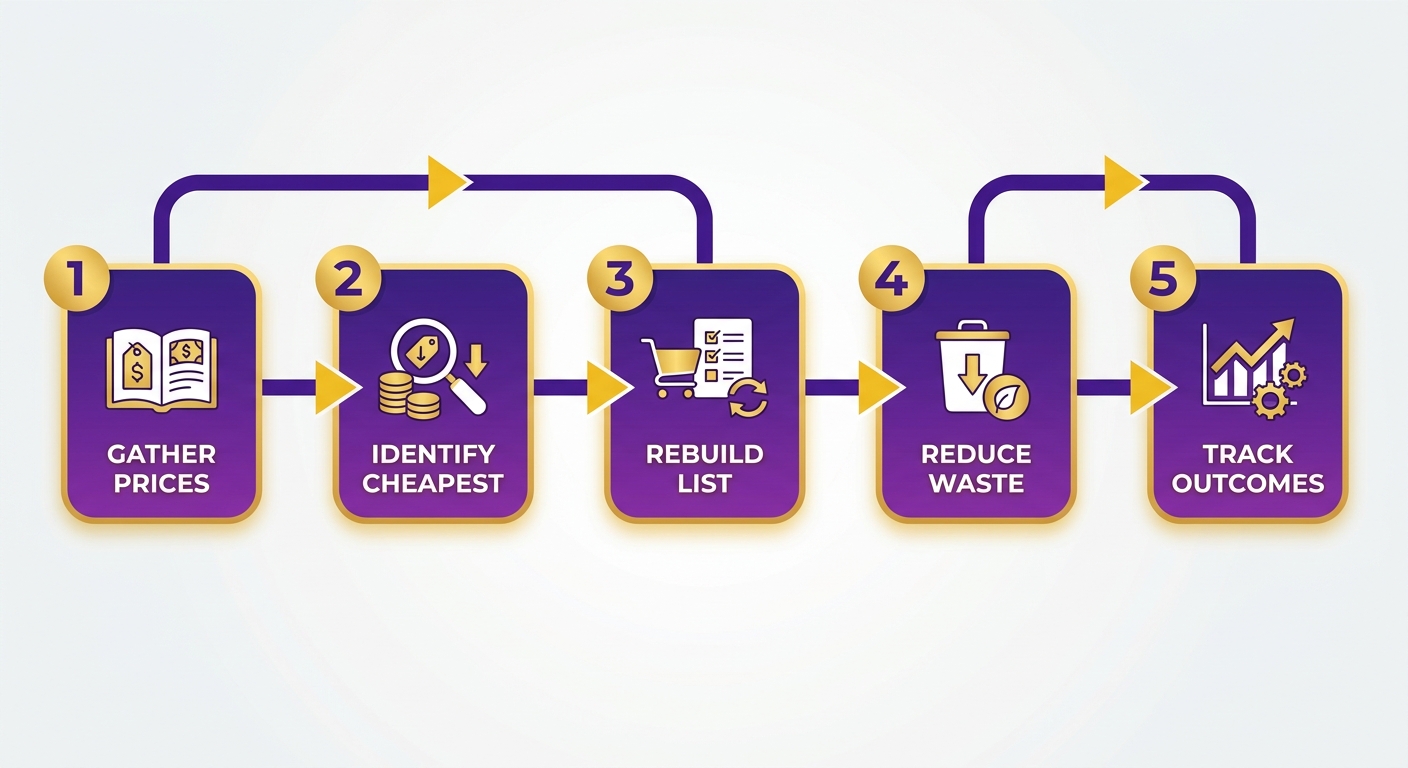
How to build a leaner list
Start with your price book, then sort every item by its lowest cost per unit. Your list becomes a set of decisions instead of habits. You buy the size and store that wins on the math, and you drop the items that consistently cost more than they're worth.
The grocery price list method builds your list around cost per volume, so a "value" pack only earns a spot if it actually beats the smaller size. A multi-vendor price comparison template lets you assign each item to the store where it's cheapest, so your list routes you to the right place for each purchase.
Tracking sale prices matters here too. The Vertex42 grocery price book logs sale prices alongside regular ones, so you know whether a "deal" beats the normal low point or just looks like it does.
Where the waste hides
In oversized packages and impulse buys you never finish. A bulk container is only a saving if you use all of it before it spoils. The math turns against you the moment any of that product hits the trash, no matter how good the shelf price looked.
This is where filtering tools earn their keep. Customizable search filters let you narrow options by size, price, or brand, so you find the budget-friendly swap without scrolling past 40 versions of the same product. Filter by lowest unit price, and the cheaper generic surfaces ahead of the name brand you grabbed out of habit.
Filter pantry staples by cost per ounce and a store-brand rice shows up at half the per-unit price of your usual bag. That single swap, repeated weekly, compounds across every staple on your list.
Why unit pricing cuts waste
Unit pricing forces you to compare value-for-money instead of guessing. In practice it does one clear thing: it stops you from overbuying a size you can't use.
Sustainability experts tie smarter buying directly to less waste. With roughly a third of food bought in many households ending up uneaten, buying only what you'll finish at the best real price means you throw out less food and spend less money at the same time.
That's the payoff. A list built on per-unit math buys less, wastes less, and costs less every single week.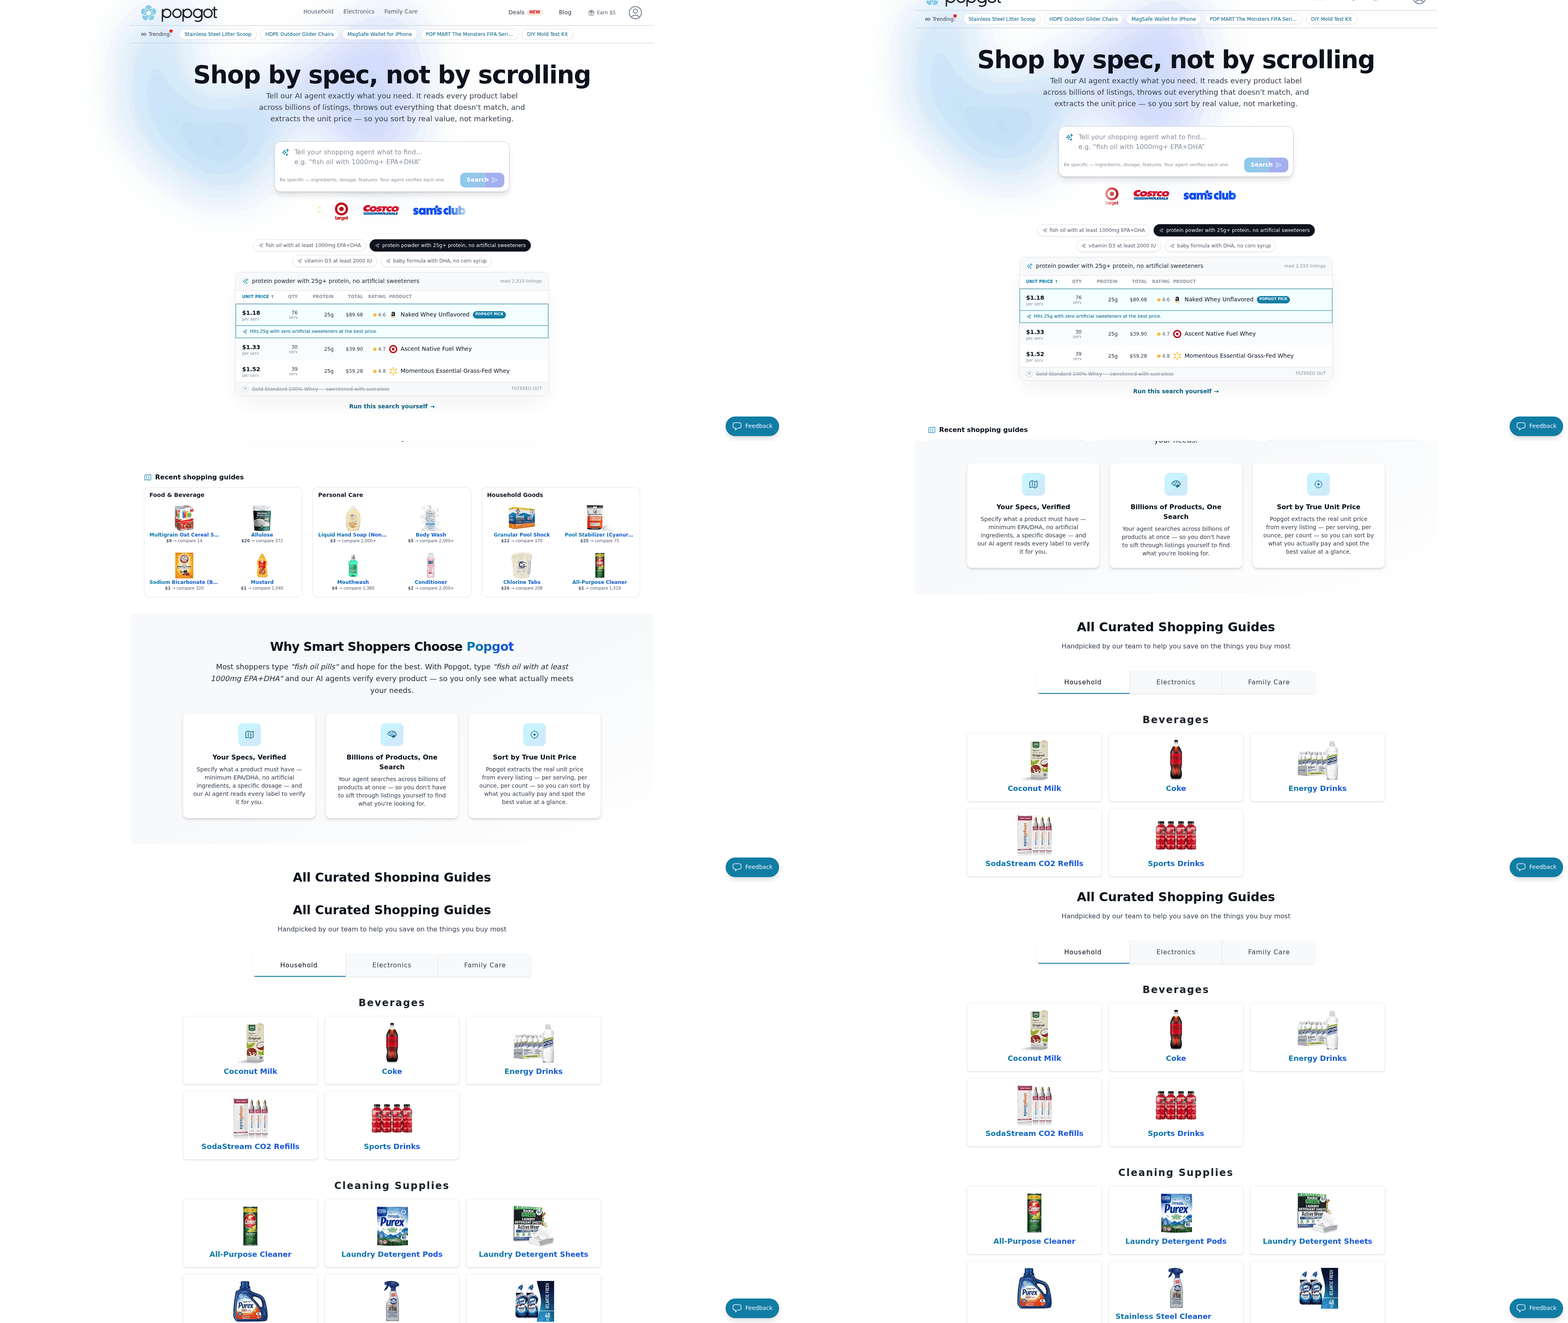
Tracking your monthly spend over time
Monitoring your monthly spend turns a one-time price-shopping win into a steady habit. You compare what you spent last month against this month, watch the trend, and set alerts so you catch price drops and overages before they cost you. Households that track this way tend to flatten the seasonal price spikes that quietly inflate a grocery budget.
The work is light. Your spreadsheet already holds the per-unit prices. Now you add a running total and a few flags that tell you when something moves.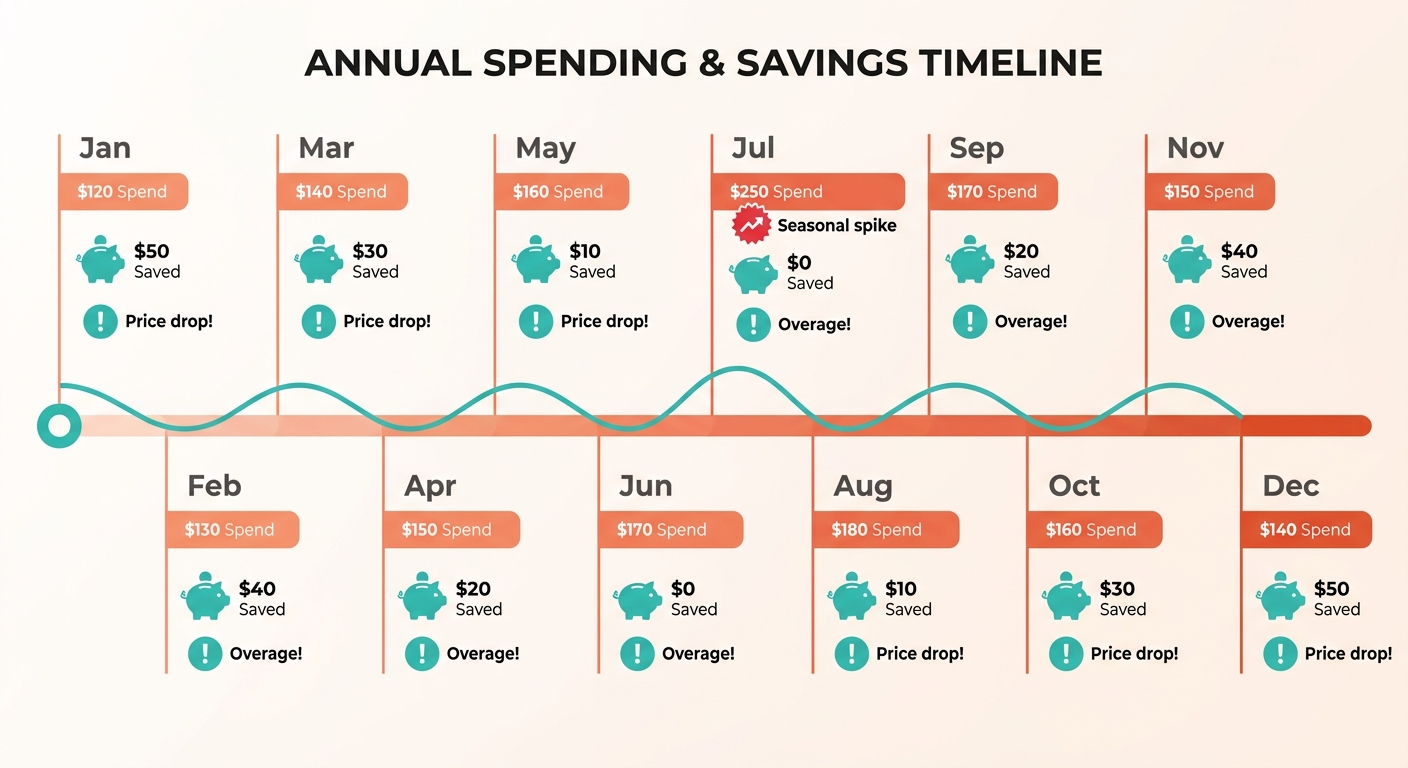
How to track spend over time
Add a date column and a monthly total to your price book, then log each shopping trip against it. The grocery price book template tracks sale prices over time, so you can see whether this month ran higher or lower than the last few.
Sort by date, then sum each month's spend in one cell. That number is your baseline. When it climbs, you scroll back to the per-item rows and find the culprit.
The cost per volume method keeps the comparison honest. You're not just watching the total drop. You're watching whether the cost per ounce of your staples holds steady or creeps up.
How to set alerts for drops and overages
Use conditional formatting to flag two things: when an item drops below its usual low, and when this month's spend runs over your baseline. The flag does the watching so you don't have to re-read every row.
Set a rule that highlights any cell where the current cost per ounce falls under your recorded low. That green cell is a buy signal. Set a second rule that turns your monthly total red when it passes last month's number.
The price comparison template's side-by-side view makes overage alerts easier. When one store's price jumps, the same row shows you a cheaper vendor.
Tools with accurate unit pricing push this further. Instead of you hand-checking each price, the platform tracks the real cost per unit and surfaces drops automatically, so your buy signals stay current without manual sorting.
What this looks like in practice
A family of four logs 25 staples and sets their monthly baseline at $640. They add a red flag for overages and a green flag for any item under its recorded low.
Month one, the red flag trips. Their total hit $690. They scroll back and find two items where their usual store quietly raised the price. They switch vendors on both and the next month lands at $610.
The green flags do the rest. When pantry staples drop below their low, the family stocks up at the bottom of the price cycle instead of guessing. A single timed stock-up on a sale item can cover several weeks of use at the lower rate, which is why catching the dip matters more than the size of any one trip. The savings come from spotting movement early, not from one big haul.
References
[1] Grocery Price Book Template - Vertex42 - https://www.vertex42.com/ExcelTemplates/grocery-price-book.html
[2] Cut your Grocery Bill with a Grocery Price List Spreadsheet - https://20somethingfinance.com/cut-grocery-bill-grocery-price-list-spreadsheet/
[3] Free Price Comparison Templates - Smartsheet - https://www.smartsheet.com/price-comparison-sheets-templates?srsltid=AfmBOoppPYQRa1Xu6zOKjzarYlrx02fpp7tpGUrG0o18aUIPi9oVg2do
[4] Consumer Awareness, Understanding and Usage of Unit Pricing - https://www.researchgate.net/publication/228137037_Consumer_Awareness_Understanding_and_Usage_of_Unit_Pricing
Frequently Asked Questions
1. What's the best formula to calculate cost per unit in a spreadsheet?
Divide total price by package size in a formula cell so it auto-recalculates when prices change. For example, a $4.50 bottle holding 30 ounces equals $0.15 per ounce. Add a separate units column to prevent mixing ounces with pounds or count with weight, which produces misleading comparisons.
2. How do I compare items sold in different units, like ounces versus count?
Convert everything to a single common unit before comparing, since mixing measurement types breaks the math. Add a dedicated units column next to package size stating whether each row is ounces, grams, or each. This keeps the division honest and ensures a 12-count pack and 24-ounce jar compare fairly.
3. Will a bulk warehouse pack always save me money?
Bulk packaging frequently costs more per unit than smaller promotional sizes, despite appearing cheaper. A $24 paper towel multi-pack can run higher per sheet than a four-roll pack on sale. Bulk only saves if you finish the product before it spoils, otherwise wasted product erases any per-unit advantage.
4. Should I track sale prices separately from regular prices?
Logging sale prices alongside regular ones reveals whether a "deal" actually beats your normal low point or just looks like it does. The Vertex42 grocery price book supports this directly. Tracking both lets you set a buy threshold and time purchases around genuine sale cycles instead of marketing tags.
5. Is the spreadsheet method worth it if I only buy a few items?
Skip the manual spreadsheet if you buy fewer than a dozen repeat items, since setup time won't pay back. The method earns its value with long, repeating lists of household and grocery staples rebought monthly. Health-conscious shoppers and parents benefit most because they restock the same items constantly.
6. What's the difference between manual tracking and an automated tool like Popgot?
Manual sheets cost nothing but time and give full control over tracked items, while automated platforms pull live retailer prices and save 2 to 3 hours weekly. Popgot's AI agent reads labels and extracts real unit prices across major retailers in one search, removing the data-entry that makes most people quit.
7. How can I use price data to time my purchases?
Log prices over several weeks to expose sale cycles, then buy at recurring low points. Track a staple like olive oil for two months; if the per-ounce price dips every few weeks, stock up during dips and skip inflated weeks. Price alerts can notify you automatically when items drop below your benchmark.