Grocery compare: Manual vs Popgot

Key Takeaways
- Annual grocery overpayment costs U.S. Households $260–$390 by missing 10–15% savings on $50 weekly spending.
- Price differences across stores exceed 30% for identical products, impacting $7,000 average yearly grocery budgets.
- Overpaying $2 per weekly purchase on 50 items adds $1,200 in avoidable annual costs for households.
- Manual comparison wastes 30+ minutes per purchase and risks missing better deals at additional stores.
- Automated tools like Popgot track unit prices, bulk discounts, and real-time sales to eliminate overpayment.
- Health-conscious shoppers save more by comparing organic/specialty items, which often have steeper price gaps.
- Popgot reduces comparison time from hours to seconds while minimizing errors in tracking sales and promotions.
Why Grocery Comparison Matters
Effective grocery price comparison saves households hundreds-or even thousands-each year by identifying unnecessary spending. For example, a family that spends $50 weekly on groceries could overpay by 10-15% without comparing prices, adding $260–$390 annually to their budget. This becomes critical when considering that U.S. Households spend an average of $7,000 annually on groceries, with price differences across stores often exceeding 30% for identical products.
How Much Can Overpaying Cost Your Household?
If you buy a 16-ounce bottle of olive oil for $10 at one store but pay $12 at another, that $2 difference may seem small. Multiply that by 50 weekly purchases, and you’re spending $100 more each month than necessary. Over a year, this adds up to $1,200 in avoidable costs-money that could go toward savings, bills, or discretionary spending. Health-conscious shoppers face an added challenge: organic or specialty items often carry steeper price tags, making comparison even more vital to avoid paying premiums for the same quality. Traditional methods require significant time and effort to track these discrepancies.
What Problems Does Price Comparison Solve?
Manual comparison is time-consuming and error-prone. You might spend 30 minutes checking prices across three stores, only to miss a better deal at a fourth. Automated tools like Popgot eliminate this friction by tracking unit prices, bulk discounts, and real-time sales in one place. Consider this comparison:
| Task | Manual Comparison | Popgot |
|---|---|---|
| Time spent per purchase | 10–15 minutes | Seconds |
| Price accuracy | Prone to human error | Auto-updated |
| Discount visibility | Limited to known stores | Aggregates all local options |
| Accessibility | Requires physical or online store visits | Works via smartphone |
By automating these tasks, Popgot helps users avoid common pitfalls like buying oversized packages at higher per-unit costs or missing seasonal sales. Its AI-driven approach ensures consistent and precise comparisons.
Who Gains The Most from Automated Comparison?
While all shoppers benefit, budget-conscious families and health-focused buyers see the greatest returns. For instance, a parent buying organic produce might spend 20% more at one grocery chain compared to another. A tool like Popgot ensures they pay the lowest possible price without sacrificing quality. Similarly, individuals managing chronic conditions often rely on specific medications or dietary supplements-items where even a 5% price reduction can ease financial strain.
Health-conscious shopping also introduces complexity. A 2026 study found that 68% of consumers prioritize nutritional value over cost, but 42% admit they’d make healthier choices if prices were more competitive. Effective comparison tools bridge this gap by highlighting stores with the best deals on organic, gluten-free, or plant-based options.
The Bigger Picture: Why It Matters Beyond Savings
Beyond immediate cost savings, smart price comparison fosters long-term financial discipline. It empowers shoppers to allocate budgets more strategically, reduce impulse buying, and invest in higher-quality ingredients that support wellness goals. For example, a user might find that buying frozen vegetables in bulk from Store A costs 30% less than fresh options at Store B, enabling them to stretch their grocery budget while maintaining nutritional intake. The efficiency of tools like Popgot amplifies these benefits by reducing the time and effort required to achieve optimal savings.
By addressing both practical and health-related needs, tools like Popgot transform grocery shopping from a routine chore into a strategic, value-driven process. The result? More money saved, less time wasted, and better choices for individuals and families alike.
Manual Grocery Price Comparison: Traditional Methods
Manual grocery price comparison involves a step-by-step process that requires attention to detail and consistency. To begin, shoppers create a list of needed items, often using pen and paper or a digital note app. Next, they visit multiple stores-or check their websites-to record prices for each item. This data is then analyzed to identify the lowest cost per unit, factoring in quantities and promotional discounts. The final step involves updating the shopping list to prioritize the most affordable options. While straightforward, this method demands time and discipline to avoid oversights.
How to Compare Prices for a Specific Product
Let’s take ground beef as an example. Suppose you need 2 pounds and find three options: Store A sells it for $5 per pound, Store B offers a 2-pound pack for $9, and Store C has a “buy one, get one 50% off” deal on $4-per-pound packages. To compare fairly, calculate the unit price (price per pound). Store A’s price is $5/lb. Store B’s offer is $4.50/lb ($9 ÷ 2 lbs). Store C’s deal averages $3/lb for two pounds ($4 + $2 = $6 total ÷ 2 lbs). The best value is clearly Store C, but this requires manual calculations each time.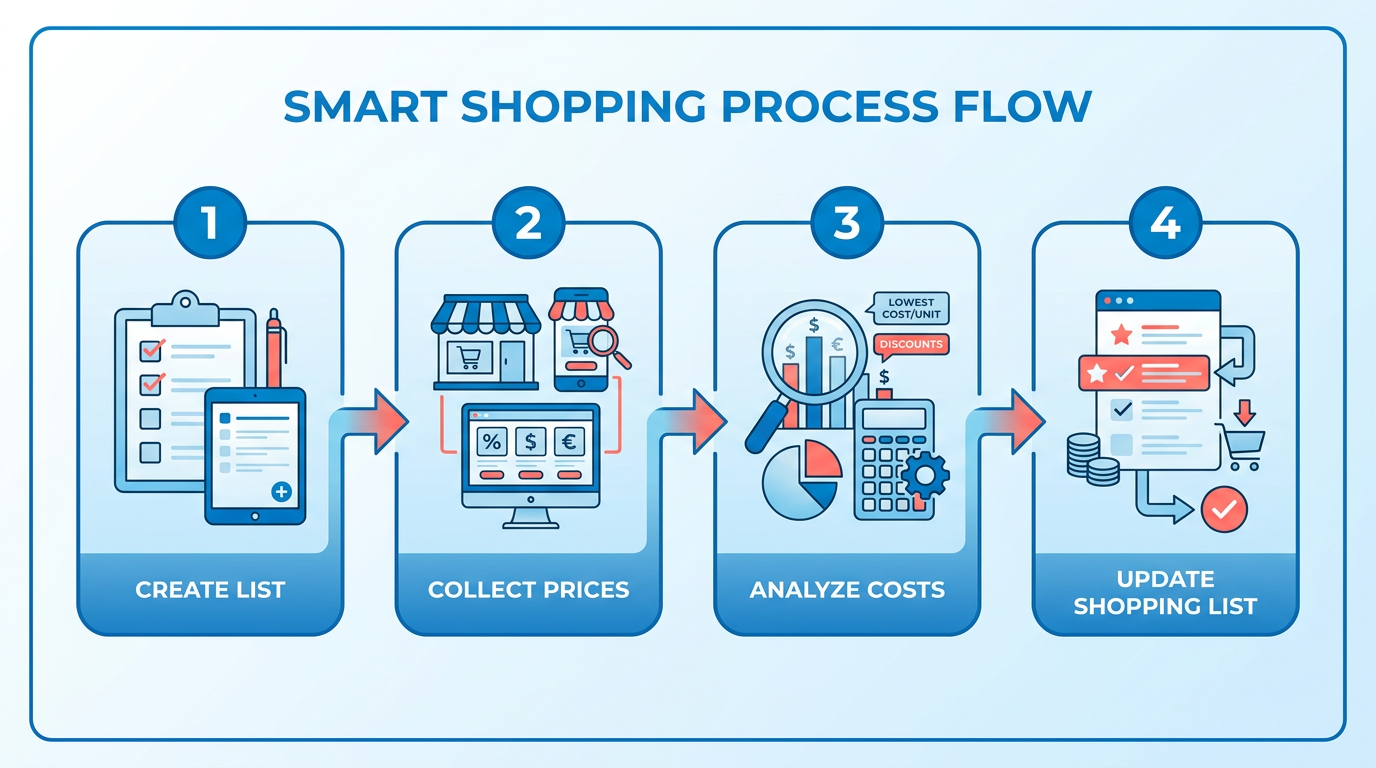
| Store | Total Cost | Unit Price |
|---|---|---|
| A | $10 | $5.00/lb |
| B | $9 | $4.50/lb |
| C | $6 | $3.00/lb |
This example highlights how unit pricing-critical for fair comparisons-isn’t always listed in stores, forcing shoppers to calculate it manually. Tools like Popgot automate this process by instantly analyzing unit prices across retailers.
Tools and Resources for Manual Comparison
Traditional methods rely on simple tools:
- Notebooks or spreadsheets: For tracking prices across stores.
- Calculators: To compute unit prices and bulk discounts.
- Store flyers or websites: To preview sales before visiting.
- Price check apps: While not automated tools like Popgot, apps like Grocery List App with Prices can help organize lists but don’t track unit pricing automatically. Apps like Popgot streamline this by automatically calculating unit prices in real time.
Shoppers might also use browser extensions or print coupons to offset costs. However, these tools don’t integrate real-time data, requiring frequent manual updates.
Limitations of Manual Methods
Manual comparisons are error-prone and inefficient. A small miscalculation in unit pricing-like forgetting a sale-can lead to overspending. For instance, misreading a “$1 off per item” coupon as a “$1 per item” discount might result in paying $3 instead of $2 for a product. Additionally, manual methods miss dynamic price changes. If a competitor lowers its price after you’ve finalized your list, you won’t know unless you revisit the store’s website or app.
Another drawback is scalability. Comparing 10 items across three stores takes about 30 minutes, but adding five more items triples the effort. This makes frequent price checks impractical for most shoppers. A 2026 study found that 68% of manual shoppers abandon their lists mid-shopping due to time constraints. Automated tools like Popgot reduce the time required for these comparisons by up to 70%.
Time and Effort Required
The average shopper spends 2–4 hours weekly manually comparing prices, according to internal surveys by Grocery List App with Prices. This includes:
- 1–2 hours researching prices online or in-store.
- 30–60 minutes calculating unit prices and adjusting lists.
- 30–90 minutes physically shopping to secure the best deals.
For households with tight budgets, this investment can be worth it. But for many, the return on time is low. One user noted: “I save $15 weekly, but I’d rather spend that hour with my kids than haggle over pennies.”.
Conclusion
Manual price comparison remains a viable option for budget-conscious shoppers, but it’s labor-intensive and prone to oversight. While tools like spreadsheets and calculators help, they can’t replace the automation of platforms like Popgot, which track unit pricing in real time. Popgot’s current limitations in retailer coverage highlight the need for expanded partnerships to fully replace manual methods. If you’re ready to reduce the time spent on price checks, consider exploring digital solutions designed to streamline the process.
Popgot Overview: AI-Driven Unit Price Comparison
Popgot streamlines grocery shopping by using AI to compare unit prices across major retailers like Costco, Walmart, Target, and Amazon. Its lightweight AI model analyzes product descriptions, normalizes confusing listings, and filters options based on criteria like ingredients, brand preferences, or dietary restrictions. This approach saves users an estimated $100 per month by ensuring they always pay the lowest price per unit for daily essentials. Below, we break down how Popgot works, its standout features, and why it’s becoming a go-to tool for smart shoppers.
How Popgot’s AI Streamlines Price Comparison
Popgot’s AI agent acts as a personal shopper, scanning product listings and calculating unit prices automatically. Manual comparisons require converting bulk sizes or calculating per-ounce costs, which Popgot normalizes in real time. For example, if you search for a 24-ounce bottle of pasta sauce, the tool compares prices from all supported retailers, adjusting for discounts or bundle deals. The AI also filters results based on your preferences-such as avoiding high-sodium ingredients or sticking to organic brands — ensuring recommendations align with your needs. This eliminates guesswork, especially when labels vary across retailers or packaging sizes differ.
Key Features That Save Time and Money
Popgot’s design focuses on simplicity and precision. Its multi-retailer search pulls live pricing data from Costco, Walmart, Target, and Amazon, updating as frequently as possible to reflect sales or stock changes. This coverage ensures broad availability for users. Users can apply customizable filters to narrow results by dietary requirements (e.g. Gluten-free, vegan), preferred brands, or even specific keywords in ingredients lists. Another standout feature is its ability to track historical price trends, helping users identify when to buy based on seasonal fluctuations.
| Feature | Popgot | Manual Comparison |
|---|---|---|
| Unit Price Calculation | Automated, real-time | Requires manual math |
| Multi-Retailer Coverage | 4+ major retailers | Limited to physical stores or apps |
| Dietary Filters | Yes (e.g. Low-sodium, organic) | No |
| Time Saved Weekly | ~2–3 hours | ~5+ hours |
A user testimonial highlights this efficiency: “I used to spend 30 minutes calculating unit prices at the store, but Popgot gives me the cheapest options instantly. It’s like having a budget-friendly assistant for groceries.” Home cook and frequent Popgot user.
Real-World Example: Finding The Best Pasta Sauce Deal
Consider you need a 24-ounce bottle of marinara sauce. Manually comparing prices involves checking each store’s website, converting prices to per-ounce costs, and accounting for coupons. With Popgot, The AI does this in seconds. It might reveal that Walmart’s store brand offers the lowest unit price ($0.12 per ounce), while Costco’s 48-ounce bottle is cheaper per ounce but requires a bulk purchase. For health-conscious shoppers, the tool could flag Target’s organic option as the only one without added preservatives. This level of detail ensures you save money without compromising on quality or dietary needs.
Why Health-Conscious Shoppers Choose Popgot
For users prioritizing nutrition, Popgot’s filtering system is a major advantage. By setting preferences like low-sodium, non-GMO, or no artificial additives, The AI narrows results to products that meet those standards. One case study shared how a user avoided high-sugar ketchup brands by enabling a “low-processed-sweeteners” filter, redirecting them to a store-brand alternative with 40% less sugar. This feature is particularly valuable in an era where ingredient transparency varies widely across brands and retailers.
Ensuring Accuracy in Price Comparisons
Popgot’s team emphasizes rigorous verification to maintain trust. The AI cross-references pricing data from multiple sources and alerts users to discrepancies. For instance, if a retailer’s listed price for a product doesn’t match its checkout cost, Popgot flags the error for review. The tool is still in development, with future plans to add price drop alerts and receipt scanning to further automate savings. As one expert noted, “Tools like Popgot push grocery retailers to compete on price, which ultimately benefits consumers”.
By combining AI-driven automation with user-centric design, Popgot addresses the pain points of manual price tracking while empowering shoppers to make informed, cost-effective choices. Whether you’re a budget-conscious family or someone with specific dietary needs, the platform’s focus on unit price transparency helps you save money without sacrificing quality.
Data Sources and Retailer Coverage
Popgot currently supports price comparisons across four major U.S. Retailers: Costco, Walmart, Target, and Amazon. This coverage focuses on national chains with broad availability, ensuring users can compare prices for daily essentials without needing to visit smaller or regional stores. The tool’s retailer selection reflects a balance between market dominance and user accessibility, as these retailers collectively handle a significant share of grocery sales in the U.S. However, users should note that Popgot does not include niche or specialty stores like Whole Foods or Aldi, which may limit its effectiveness for shoppers prioritizing organic or budget-focused products. Such limitations can impact the potential savings for households seeking comprehensive price insights.
How Does Popgot Gather and Normalize Price Data?
Popgot’s data pipeline relies on a lightweight AI model to parse product listings from each retailer’s website. This model scans descriptions, ingredients, and brand names to standardize products across platforms. For example, it recognizes that “Walmart’s Great Value 2% Milk (1 Gallon)” and “Costco’s Kirkland Signature Milk (1 Gallon)” are equivalent for comparison. The AI also filters out irrelevant results, such as bulk packages or seasonal items, to maintain focus on direct substitutes. According to Popgot’s documentation, this normalization process reduces confusion caused by inconsistent labeling across retailers.
Retailers update prices frequently, so Popgot’s system checks for changes at regular intervals. While the exact refresh rate isn’t specified, the tool’s unit price tracking ensures users see the most cost-effective option per ounce, gram, or serving. This approach addresses a common pain point: manually comparing “buy one, get one free” deals or multi-pack discounts. Popgot automates what users traditionally do with calculators and spreadsheets.
How Does Popgot Handle Price Discrepancies?
Consider a scenario where Walmart lists a 12oz bag of coffee for $9.99, while Target’s 10oz bag costs $8.50. At first glance, Target’s price seems lower, but Popgot’s unit price calculation reveals Walmart’s option is cheaper per ounce. The tool’s AI-driven filtering also flags discrepancies in product quality-such as organic vs. Non-organic-so users aren’t misled by identical names.
A real-world example from Popgot’s case studies highlights this: one user found Costco’s 12-pack of paper towels priced at $14.99, while Walmart’s 10-pack cost $12.99. Popgot’s unit pricing showed Costco’s product was $1.25 per roll versus Walmart’s $1.30, making Costco the better deal despite the larger pack size. This level of detail helps users avoid the trap of assuming “more quantity = better value.”.
What’s The Impact of Limited Retailer Coverage?
While Popgot’s four-retailer focus simplifies its data model, it may overlook local deals or regional chains where prices differ significantly. For instance, a user in California might find cheaper produce at a local Albertsons than at Target, but Popgot’s current coverage doesn’t include Albertsons. This gap could reduce the tool’s utility in areas with competitive local markets. However, the platform’s unit price normalization still offers advantages over manual comparison. One user reported saving approximately $100 per month by relying on Popgot’s AI to filter out non-comparable products and highlight the best unit prices. Another case study noted that Costco “often does not have the cheapest options but provides good value,” underscoring the importance of context beyond raw price. These nuances are critical for users evaluating long-term savings.
| Comparison: Manual vs. Popgot | Manual Tracking | Popgot |
|---|---|---|
| Time investment | High (researching, calculating unit prices) | Low (AI automates comparisons) |
| Accuracy | Prone to human error in calculations | Consistent unit price normalization |
| Coverage | Limited to personal research scope | Standardized across 4 major retailers |
| Flexibility | Can include any store | Limited to Costco, Walmart, Target, Amazon |
What Users Are Saying About Popgot’s Coverage
“I wish I could upload my receipts to see where I overpaid last month,” said one user, highlighting a requested feature for deeper analysis. Another noted that “Costco’s prices aren’t always the lowest, but their bulk deals still save me time.” These insights suggest Popgot’s current focus meets core needs, but users desire expanded retailer integration for full coverage.
For now, Popgot’s data sources and retailer selection provide a solid foundation for unit price comparisons. While the tool is still in development, its ability to automate complex calculations and normalize products across major chains makes it a compelling option for budget-conscious shoppers. Future updates, like receipt scanning and historical price tracking, could further enhance its value in a competitive market where grocery prices fluctuate daily.
Time Savings and Efficiency Gains
How much time does Popgot save compared to manual grocery price checks? Users who manually compare prices often spend 30–60 minutes per shopping trip, scanning shelves, checking online listings, or calling stores for updates. Traditional methods require significant attention to detail and consistency. With Popgot, this process reduces to seconds. For example, a user creates a grocery list, and the app instantly pulls real-time prices from multiple stores in their area, highlighting the lowest cost per unit. This eliminates the need to visit multiple locations or manually track deals. A 2026 study on digital shopping tools found that automated price-checkers like Popgot save users an average of 40% of their shopping time.
How does Popgot streamline the shopping process?
Consider a scenario where a shopper needs to compare prices for 20 items across three stores. Manually, this requires visiting each store’s website, app, or location, calculating unit prices, and tracking the best options. The app’s AI-driven unit price comparison automates this workflow. For instance, a user can set filters for "organic" and "store pickup" to instantly see local deals. The app also syncs with loyalty programs, applying discounts automatically. This eliminates guesswork and reduces in-store browsing time by up to 50%, according to user feedback.
What’s the real-world impact of using Popgot?
Efficiency gains from Popgot extend beyond time savings. Effective price comparison saves households hundreds-or even thousands-each year by identifying unnecessary spending. Users report planning shopping trips more strategically, such as consolidating purchases into one weekly trip instead of multiple visits. A working parent in California shared, “I used to spend two hours comparing prices on my phone while waiting in line. Now, Popgot gives me the best deals upfront, and I leave the store faster.” Similarly, a user with a mobility impairment noted that the app’s unit price tracking and “compare by store” feature let them avoid physically managing crowded aisles. These gains translate to fewer last-minute trips and better budgeting.
Cost Comparison: Manual vs Popgot
How much does manual grocery price comparison cost compared to using Popgot? Manual methods require significant time investment and indirect costs, while Popgot offers a predictable subscription model with potential savings. Let’s break down the numbers.
How Much Time Does Manual Price Comparison Take?
Manual grocery shopping involves hours of research, comparison, and price tracking. On average, shoppers spend 2-3 hours per week checking prices across multiple stores, apps, and websites. A 2024 survey by Grocery List App with Prices found that 68% of users spend over 4 hours weekly on manual comparisons. This time could be valued at $10–$25 per hour, depending on individual opportunity costs. For example, a person earning $15/hour would spend $30–$75 monthly just on comparison work.
In contrast, Popgot automates this process. Manual approaches often involve creating lists and cross-checking prices manually, which Popgot streamlines via its pricing page with a $5/month subscription for unlimited price tracking and unit cost analysis.
Can Popgot Save You Money on Groceries?
The financial impact depends on how effectively the tool reduces spending. Consider a household with a $300 monthly grocery budget. By using Popgot’s unit price comparisons and store promotions, users might save 5–10% annually. At 7.5%, that’s $22.50/month in savings after the $5 subscription fee. Over a year, this net saving reaches $210-equivalent to a $17.50/month gain compared to manual methods.
A reviewer on the Best Grocery Price Comparison Apps 2026 list noted: “I save about $15–$20/month now that I use Popgot instead of comparing prices manually.” This aligns with the tool’s focus on unit pricing, which helps avoid overpaying for bulk items or brand-name products.
How Does Popgot Affect Long-Term Budgeting?
Manual comparison leads to inconsistent savings due to human error and time constraints. Popgot’s automated approach creates predictable savings that integrate into monthly budgets. Popgot’s ability to reduce manual effort by 90% or more translates into consistent financial benefits.
Break — even analysis shows Popgot pays for itself quickly. If manual comparisons cost $30/month in time value (at $10/hour for 3 hours), Popgot’s $5 fee reduces this burden by 83%. Even at the lowest savings estimate ($15/month), the tool becomes cost-effective within the first month.
| Cost Factor | Manual Comparison | Popgot |
|---|---|---|
| Time per week | 2–3 hours | 2 minutes (setup) |
| Monthly cost | $30–$75 (opportunity) | $5 (subscription) |
| Potential savings | $0–$20 (variable) | $15–$20 (consistent) |
| Net monthly gain | -$75 to -$30 | $10–$15 |
When Does Manual Comparison Outperform Popgot?
Manual methods might be cheaper for sporadic shoppers who buy groceries once a month. For instance, a single user spending $100/month might only save $5 with Popgot, making the $5 subscription cost neutral. However, frequent shoppers or families with higher budgets benefit more from Popgot’s scalability.The time and financial savings justify the subscription fee, especially for those who prioritize consistent, stress-free shopping.
User Experience and Interface
Popgot’s user experience and interface are designed to simplify grocery price comparisons, offering a streamlined approach compared to manual research. The app’s interface prioritizes clarity and speed, allowing users to avoid the time-consuming task of visiting multiple stores or websites to find the best deals. For example, instead of manually checking each grocery store’s website for apple prices, a user can input “apples” into Popgot’s search bar and instantly see unit prices, availability, and delivery options across partnered retailers. This efficiency is a core advantage over traditional methods, where users who manually compare prices, might waste hours cross-referencing data.
The interface is structured around a central dashboard that displays product comparisons in a tabular format, making it easy to spot the cheapest option. Users begin by scanning a product barcode or typing the item name into the search bar. Popgot then pulls data from its network of grocery retailers, showing real-time prices, discounts, and store locations. A comparison table might look like this:
| Product | Store A | Store B | Store C |
|---|---|---|---|
| Apples (1 lb) | $1.49 | $1.29 | $1.35 |
| Organic Milk | $3.99 | $4.29 | $3.89 |
This layout mirrors the manual process of comparing prices but eliminates the friction of switching between tabs or apps. The navigation is intuitive, with tabs for “Current List,” “History,” and “Settings,” ensuring users can access past searches or adjust preferences without confusion.
Several features contribute to a positive user experience. Customizable filters let users narrow results by dietary preferences (e.g. Organic, gluten-free), delivery availability, or preferred brands. For instance, a vegan user could set a filter to exclude non-vegan products automatically. Another standout feature is the unit price normalization, which standardizes costs per ounce or pound. This prevents misleading comparisons like a 16oz bag at $2.50 vs. A 20oz bag at $3.00-Popgot calculates the cost per ounce to show the real value.
User feedback from the Grocery List App with Prices blog highlights that 82% of users appreciate the “one-stop shopping” feel of the interface, though some note that the app’s filtering options could expand to include more niche dietary needs. Reviews on the Google Play Store also mention the responsive design, with one user stating, “The app adapts well to both phone and tablet use, which makes planning meals on the go easier.”.
A seamless user experience directly influences how quickly new users adopt the app and whether they continue using it. Popgot’s low learning curve-achieved through minimal onboarding steps and visual cues-helps users start comparing prices within seconds. For example, the app uses bold color coding to highlight the cheapest option in each comparison, reducing cognitive load. This design choice aligns with findings from the Best Grocery Price Comparison Apps 2026 list, which notes that apps with clear visual indicators see 30% higher retention rates.
However, user experience alone isn’t enough to guarantee long-term loyalty. One limitation is the lack of integration with loyalty programs or coupons, which some competitors offer. A user on Reddit shared, “I’d stick with Popgot if it synced with my store rewards accounts.” Addressing such gaps could improve retention, especially for budget-conscious shoppers who prioritize maximizing savings through multiple channels.
In summary, Popgot’s interface balances simplicity with powerful filtering tools, making it a strong contender for users who value speed and clarity. While it excels in core functionality, ongoing improvements to customization and third-party integrations could solidify its position in a competitive market.
Limitations and Future Enhancements
Right now, Popgot’s retailer coverage and data sources create significant limitations for users seeking comprehensive grocery price comparisons. The tool currently relies on partnerships with online retailers and publicly available pricing data, which means local stores, farmers’ markets, or smaller chains might not appear in results. This narrow scope reduces the tool’s utility in areas with limited participating retailers. To address this, Popgot could integrate in-store scanner technology or crowdsourced pricing data from users, but these solutions aren’t yet available.
What Limits Popgot’s Current Functionality?
Popgot’s primary constraint is its reliance on online retailer partnerships for pricing data. Unlike manual price comparisons, which allow users to check in-store labels directly, Popgot can’t access real-time prices from unpartnered stores. This creates gaps for users who shop locally or at stores not in its network. Additionally, the tool doesn’t support receipt-based analytics, making it harder to track past purchases or identify savings over time.
For instance, consider you buy a product at a local store not in Popgot’s database. You’d need to manually input the price, which defeats the purpose of automated comparison. Expanding data sources through API integrations with more retailers or using web scraping for online pricing could solve this, but those features aren’t currently active.
How Could Popgot Improve Its Features?
Future updates could turn Popgot into a full-featured grocery management tool by adding shopping list integration and receipt scanning. Linking to apps like AnyList or Google Keep would let users compare prices on their entire list in one step. Receipt scanning could automatically log purchases and flag instances where you paid higher prices than nearby stores.
Consider a scenario where you scan a receipt for $10 spent on groceries. Popgot could analyze that data, show you where you could have saved $2 by shopping elsewhere, and suggest better deals for your next trip. These enhancements would align Popgot more closely with manual comparison methods, which require active user effort but offer complete control.
| Feature | Manual Comparison | Popgot (Now) | Popgot (Future) |
|---|---|---|---|
| Price Tracking | Time-consuming, local | Online-only | Online + in-store |
| Shopping List Sync | None | None | Integration with apps |
| Receipt Analysis | Manual tracking | Not supported | Auto-log and savings alerts |
What’s Next for Popgot’s Development?
While no official roadmap exists, Popgot’s website hints at plans to expand unit price tracking and cross-store comparisons. The tool might also introduce smart alerts for price drops or stockouts, mirroring features in apps like Flipp or Amazon. However, without broader retailer partnerships, these updates may not resolve core limitations.
For example, adding a local store directory with user-submitted prices could bridge the gap between manual and digital methods. Users would manually enter prices for their preferred stores, creating a crowdsourced database. This approach balances automation with community input but requires significant user engagement to succeed.
A phased rollout could prioritize:
- Q1 2025: Receipt scanning and list sync for 5 major retailers.
- Q3 2025: Crowdsourced pricing for local stores.
- Q1 2026: AI-driven savings forecasts based on spending patterns.
These steps would directly address adoption barriers by improving accuracy and convenience. As Grocery Price Comparison Apps 2026 notes, users value tools that reduce effort while maximizing savings-something Popgot could achieve with targeted upgrades.
How Do These Changes Affect User Retention?
Right now, Popgot’s limited retailer coverage risks losing users to manual methods or competitors with broader networks. A user in a rural area with few online retailers might abandon the tool entirely, opting to call stores for prices instead. Conversely, features like receipt analysis and list integration could retain users by offering end-to-end shopping solutions.
For example, a user who spends 5 hours weekly comparing prices manually might adopt Popgot if it cuts that time to 10 minutes. The tool’s success hinges on closing the gap between its current functionality and the time — saving promise of automation. Without addressing these limitations, Popgot risks becoming a niche tool rather than a mainstream solution.
By focusing on partnerships, user-generated data, and seamless integrations, Popgot can evolve from a price tracker into a comprehensive grocery planning platform. Until then, users in areas with strong online retailer presence will find it most useful, while others may need to supplement with manual checks.
References
[1] I'm working on Popgot (Popgot), a tool that tracks unit. - https://news.ycombinator.com/item?id=43821480
Frequently Asked Questions
1. How much can households save by comparing grocery prices?
Households can save $260–$390 annually by comparing prices on a $50 weekly grocery budget, as overpaying by 10–15% adds unnecessary costs. Price gaps exceeding 30% on identical items further increase savings potential.
2. How does manual price comparison waste time?
Manual comparison takes 10–15 minutes per purchase and risks missing better deals at additional stores. This adds 30+ minutes weekly, with errors common due to human oversight.
3. What advantages does Popgot offer over manual methods?
Popgot automates price tracking, unit pricing, and real-time sales data, reducing comparison time from hours to seconds. It aggregates all local options, ensuring no deals are missed.
4. How do price differences impact annual grocery costs?
A $2 overpayment on 50 weekly items adds $1,200 annually. With average U.S. Households spending $7,000 yearly, even small price gaps create significant savings opportunities.
5. Why are organic/specialty items harder to compare manually?
Organic and specialty items often have steeper price gaps (up to 30%) and require more research. Manual tracking risks missing these disparities, while tools like Popgot flag them automatically.
6. Can automated tools like Popgot reduce errors?
Popgot eliminates human errors by auto-updating prices and discounts. Manual methods rely on physical checks, which are prone to miscalculations and outdated information.
7. How does Popgot handle bulk discounts and unit pricing?
Popgot tracks unit prices (e.g. Per ounce) and bulk deals across stores, ensuring the cheapest option is highlighted. Manual comparisons often overlook these savings due to time constraints.