
Why Camelcamelcamel's "Lowest Ever" Hides Shrinkflation Until You Check Per-Ounce Price

Key Takeaways
- Shrinkflation holds the sticker price steady while the package gets smaller, so the price you actually pay per ounce quietly climbs.
- Price trackers like Camelcamelcamel watch the tag, not the ounces inside. A "Lowest Ever" alert can be flat-out wrong.
- Companies raise your unit cost two ways: bump the retail price, or shrink the package. Research shows they usually pick one.
- Shrinking the package is the sneakier move, because you anchor on the price you always pay and never re-read the net weight.
- It targets the stuff you rebuy on autopilot: soap, bodywash, snacks, cleaning supplies. The label goes unread.
- Checking price per ounce or per unit is the one defense that trackers ignoring package size can't give you.
- A Dove bar dropping from 4 ounces is the whole trick in miniature: same price, less product.
Why a "Lowest Ever" Alert Can Still Cost You
Shrinkflation is simple. The package shrinks, the price doesn't. You pay the same dollar amount and walk out with less. The sticker looks stable while the per-unit cost creeps up behind it.
That's why a "Lowest Ever" alert can lie to you. A price tracker watches the number on the tag. It has no idea how many ounces are inside the box.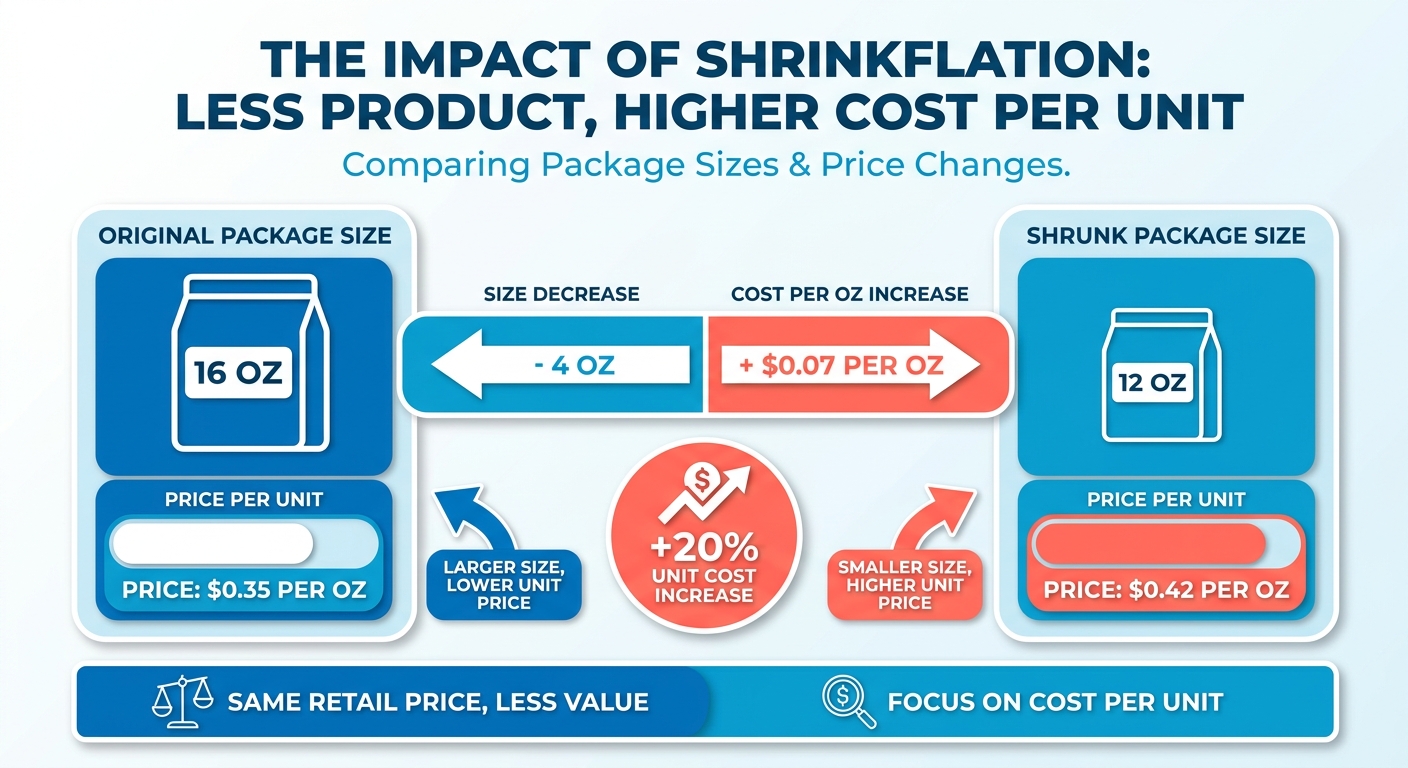
What shrinkflation actually is
Shrinkflation is a price hike wearing a disguise. The dollar figure on the shelf holds, but the price per unit goes up, as a KUOW report on unit prices puts it, a dollar per ounce or two cents per Cheeto.
Companies have two levers to raise your unit cost. Raise the retail price, or shrink the package. Research on unit price increase tactics found packaged-grocery marketers generally pick one or the other, not both.
Shrinking the package wins because your brain anchors on the price you always paid. It almost never re-checks the net weight buried in the fine print.
Why it hides in your everyday essentials
It lives on the products you rebuy without looking. Soap, bodywash, snacks, cleaning supplies. Habit purchases, which means you've stopped reading the label.
Toothpaste is a clean example. Drop a tube from 5 ounces to 4.5 while holding the price, and your cost per ounce climbs. The box on the shelf looks identical, so you grab it on autopilot and never notice you got less. Liquid hand soap does the same thing: a bottle sheds a few ounces between restocks, you get fewer handwashes per purchase, and your weekly receipt reads exactly the same.
None of these feel like much on their own. A quarter-ounce here, a few ounces there, week after week. Across a full cart it compounds into real money leaving your wallet for less product.
Why the per-ounce number is the only honest one
The tag price alone lies. The price per unit is the number that doesn't, whether it's per ounce, per sheet, or per load.
Shift your eyes to the bottom of the shelf tag and you're comparing the actual ingredients, not the cardboard around them. The KUOW shopping guide leans on the same move. Compare that number across sizes and brands and the picture changes fast.
A "Lowest Ever" alert on a downsized package isn't a discount if the older, bigger version was a better value per ounce. All the alert flags is a lower absolute price for less product. Know the real per-ounce cost and you stop paying more for less. That's the entire game.
For a deeper look at comparing true costs across retailers, this guide to cheaper essentials walks through the same per-unit logic.
Where Shrinkflation Actually Shows Up
It's in almost every aisle. Food, household goods, personal care, the pattern never changes: the box looks familiar, the price feels stable, the ounces inside quietly dropped.
When production costs rise, a company has to pass them along somehow. The ResearchGate study on pricing tactics found shoppers react hard to changes in the digits on the tag but routinely miss quiet cuts to package volume. So size reduction becomes the preferred way to hold a margin without spooking anyone.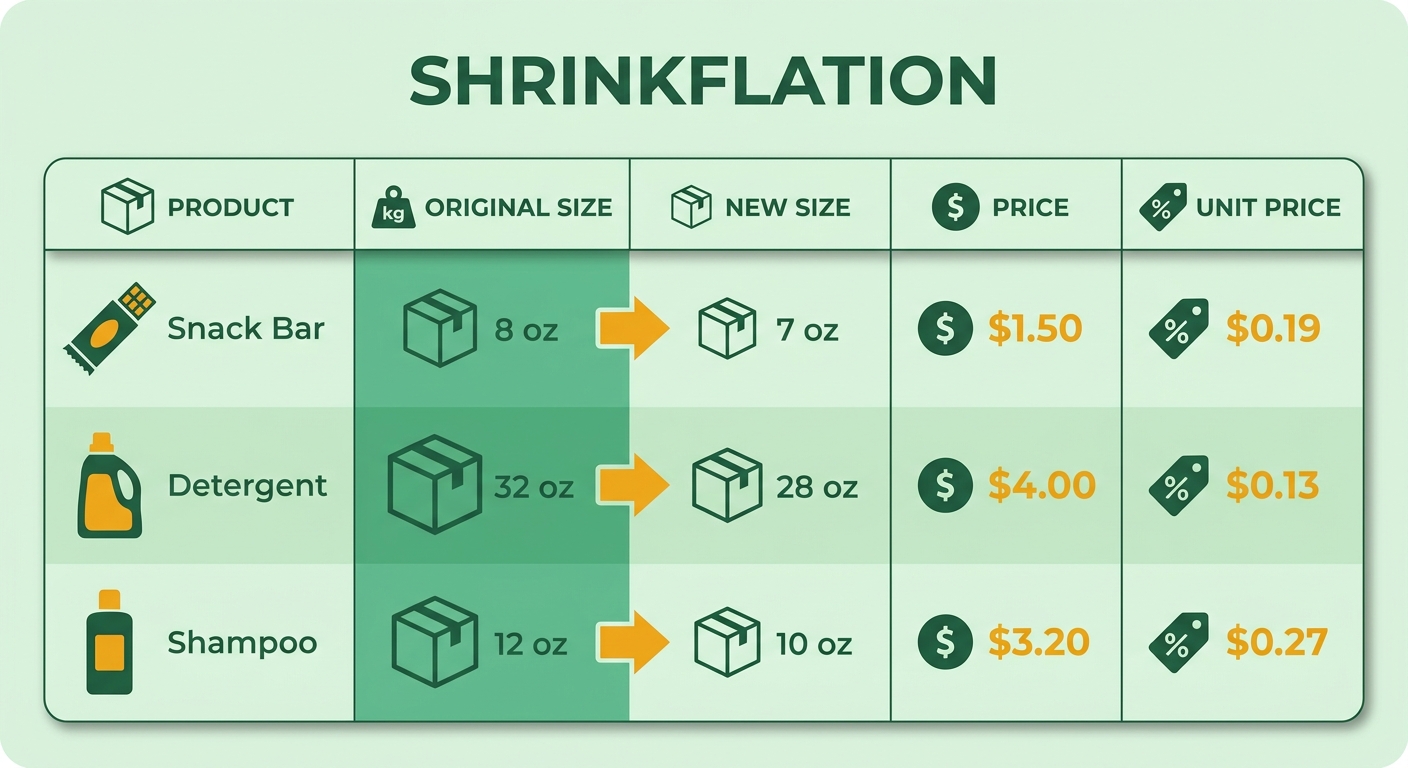
Food is the classic offender
A snack bag that held 16 ounces last year might hold 14 now at the same price. Your per-ounce cost just went up while the sticker sat still.
Chips and crackers are the obvious case. Manufacturers trim the net weight but keep the bag the same size, puffing it out with nitrogen so your hand feels the same heft. The KUOW report walks through how these small volume cuts inflate pantry staples without setting off any alarm.
The rest of the aisle plays the same game. Cereal boxes keep their height and lose width. Ice cream containers dimple inward at the bottom. Coffee cans slip from a full pound to fourteen ounces. Shelf price holds, unit price moves.
Household and personal care shrink by count and volume
Here the trick runs on sheets and ounces. A roll of paper towels loses sheets. A detergent bottle drops from 50 ounces to 45. A bar of soap sheds a few grams. The container looks untouched.
Toilet paper is the usual suspect. The roll keeps its diameter, but the sheets get shorter or the ply gets thinner. Same "double roll," fewer square feet.
Personal care follows right along. Shampoo bottles, toothpaste tubes, lotion pumps all lose volume between reformulations. The bottle design stays put so your eye slides past the change.
Unit pricing is the only thing that catches it
The one way to catch this is to watch the price per unit, not the total. Dollars per ounce, cents per sheet, price per 100 grams. It's the exact number a "Lowest Ever" alert throws away.
Most stores print it on the shelf tag in small type. Read the small number, not the big one. Two brands side by side, and the cheaper sticker often loses on cost per ounce.
Online, same rule. A tracker flagging a low dollar amount tells you nothing about what shrank inside the box. Comparing per-unit cost across sellers is how you tell a genuine deal from a smaller package. Tools built for easy price comparison across sellers line those numbers up before you buy.
Four things to carry into every trip:
- Don't trust the sticker alone. A steady dollar figure can hide a shrinking package.
- Read the unit price on the tag. Dollars per ounce is the honest number.
- Compare per-unit cost across brands and sellers. Lowest total price isn't always lowest cost per ounce.
- Distrust "Lowest Ever" alerts. They track the tag, not the ounces.
Shop by cost per unit and shrinkflation loses its cover.
Using Popgot to Spot a Shrinking Box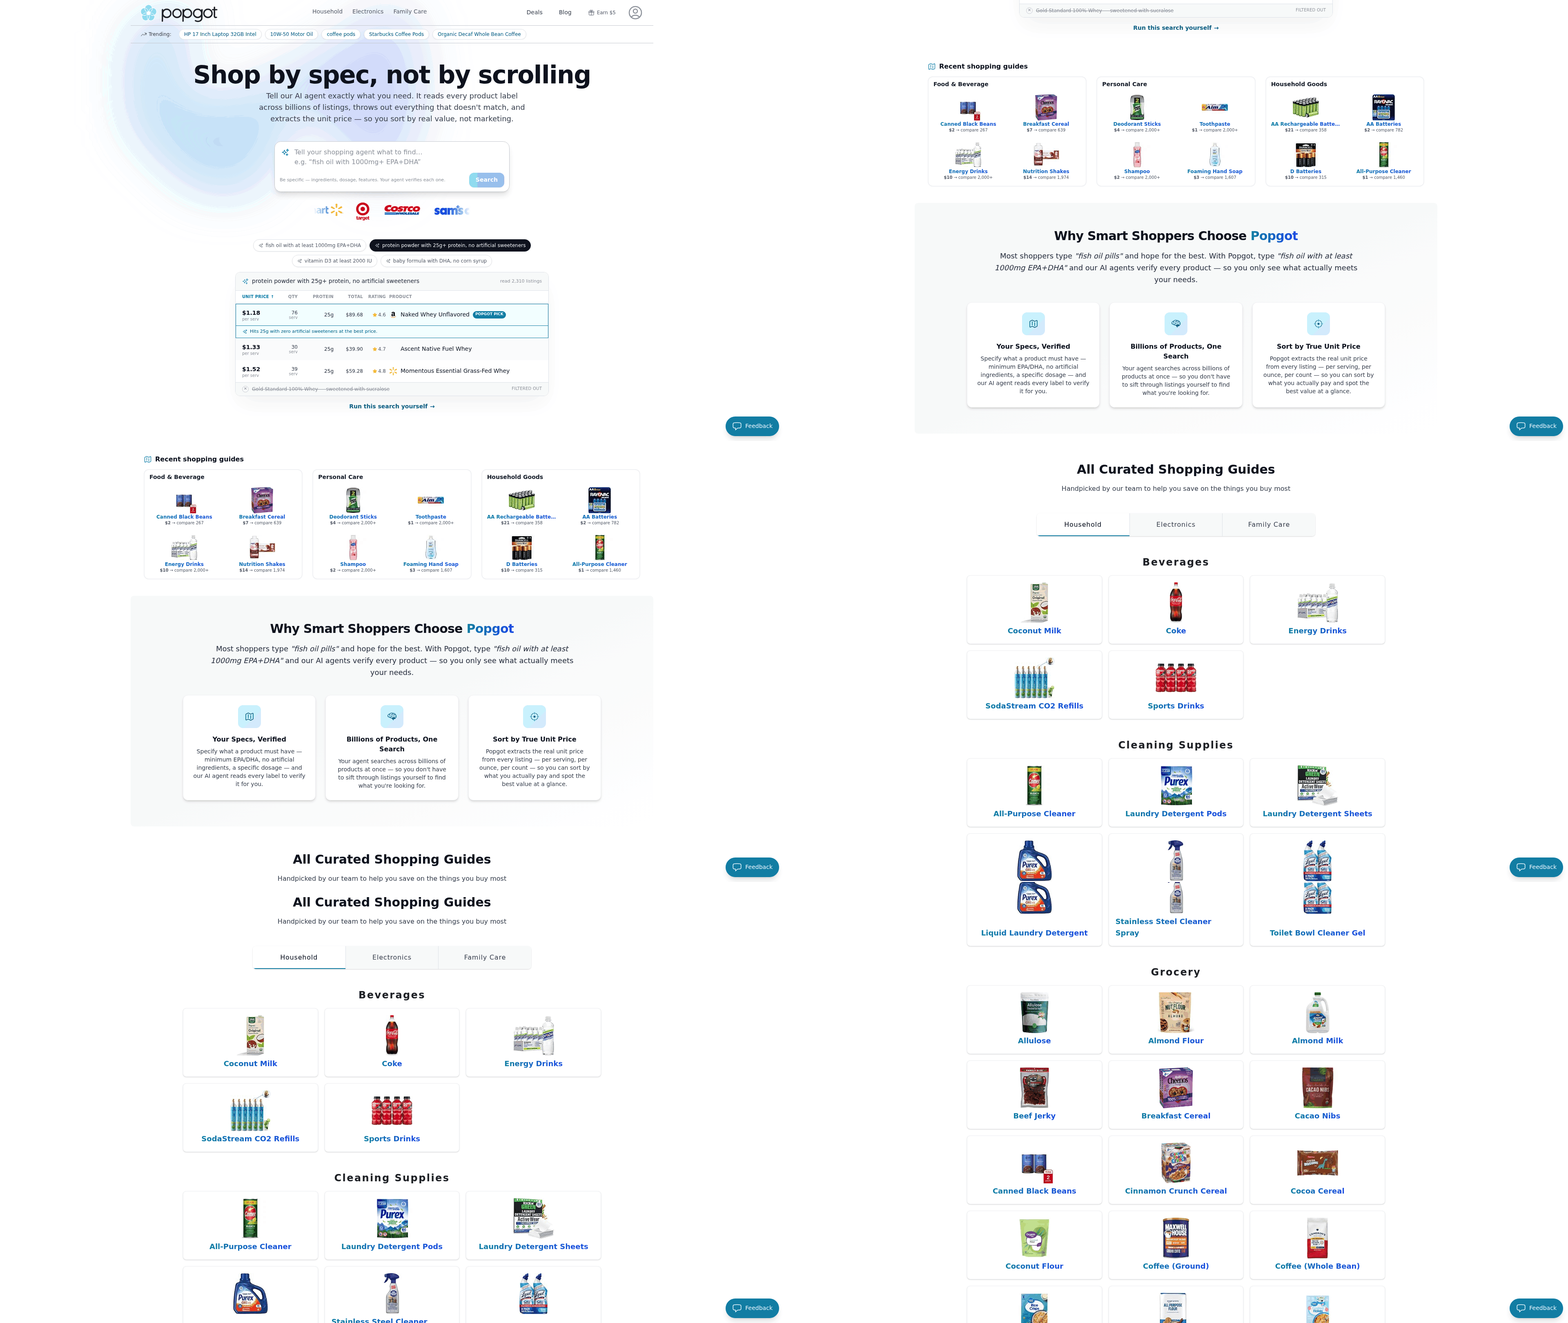
A tracker that only watches the sticker misses half the story. To catch shrinkflation you need one that shows price per ounce, not just the number on the tag. Change what you measure and you spot the shrinking box before it costs you.
A dollar per ounce that quietly becomes a dollar-thirty is a price hike, even if the shelf tag never budged. Track the unit value instead of the total and the manufacturer's volume cut shows up the moment it happens.
The workflow that catches it
Pull up the per-unit cost for whatever you buy most, then track that number over time instead of the flat price. When ounces drop and the tag holds, the unit price climbs. That climb is your alert.
-
Find the unit price, not the shelf price. Dollars per ounce, cents per sheet, price per count. This is the number that exposes a smaller package.
-
Log it before you buy. A "Lowest Ever" flag means nothing if the box lost two ounces. Check whether the per-ounce figure actually dropped.
-
Compare across sizes and sellers. The bigger box isn't always cheaper per ounce. Run the numbers side by side and let the math decide, not the marketing.
This gets stronger online. Using easy Google Shopping price comparison, you can scan multiple retailers for the lowest baseline cost per unit and avoid paying a premium for a downsized box.
A quick example
A cereal box sits at the same price for a year. Last spring it held 18 ounces. This year, 15. The tag reads the same, so a plain tracker calls it stable. The unit price jumped. Watch per-ounce cost and you catch the shrink the moment it lands.
Buy the ounces, not the box.
Why Unit Pricing Beats Sticker Tracking
Accurate unit pricing ties the price you compare to a consistent measure, an ounce, a sheet, a load, instead of the number on the tag. Measure by the unit and you catch the price hike a package swap is trying to hide.
A shrinking box only fools you if you count boxes. Count ounces and the trick falls apart.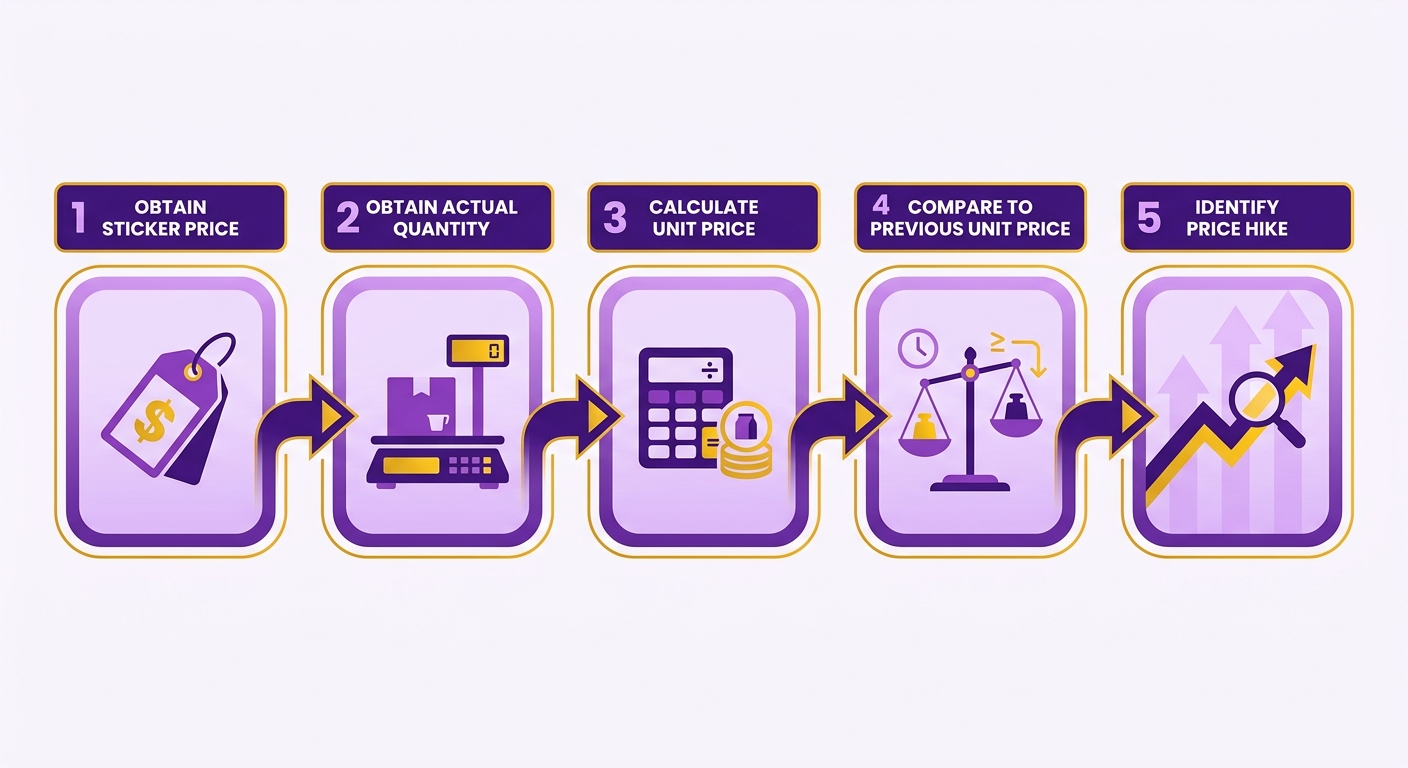
Sticker tracking assumes the product never changes
That's the flaw. Sticker tracking treats the product as a constant. The ResearchGate study on pricing tactics found that when brands alter packaging volume instead of price, shoppers feel less "payment pain," which lets companies adjust margins without triggering brand switching.
When a package quietly loses volume, your per-unit cost rises even though the tag never moves. You keep buying at what feels like the same price and paying more for the same amount of product. A bottle of laundry detergent slipping from 100 ounces to 90 is a 10% price hike. Without unit-level tracking you keep grabbing the same bottle, never noticing your cost per load went up.
What it looks like on things you rebuy
Convert every price into a per-unit number and you compare apples to apples across sizes and time. Your usual paper towel roll holds 140 sheets at a fixed price. Next month the same brand ships 120 sheets at that identical price. The tag looks like a win. The per-sheet cost jumps, and unit pricing flags it right away.
Standard trackers miss this entirely. They log the tag, celebrate a steady or "lowest" price, and stay quiet while your cost per sheet climbs. A tool that only reads the tag reports a false all-clear.
On staples you rebuy constantly, that small per-unit creep adds up fast. KUOW's two-cents-per-Cheeto framing is the whole point: micro-increases on individual items pile up across a weekly trip. Track those categories by unit and you spot the shrink before it becomes a habit. If your coffee's per-ounce cost ticks up while the price holds, you switch brands or sizes and keep your spending flat.
Measure by the unit, buy on the unit, and shrinkflation loses its cover.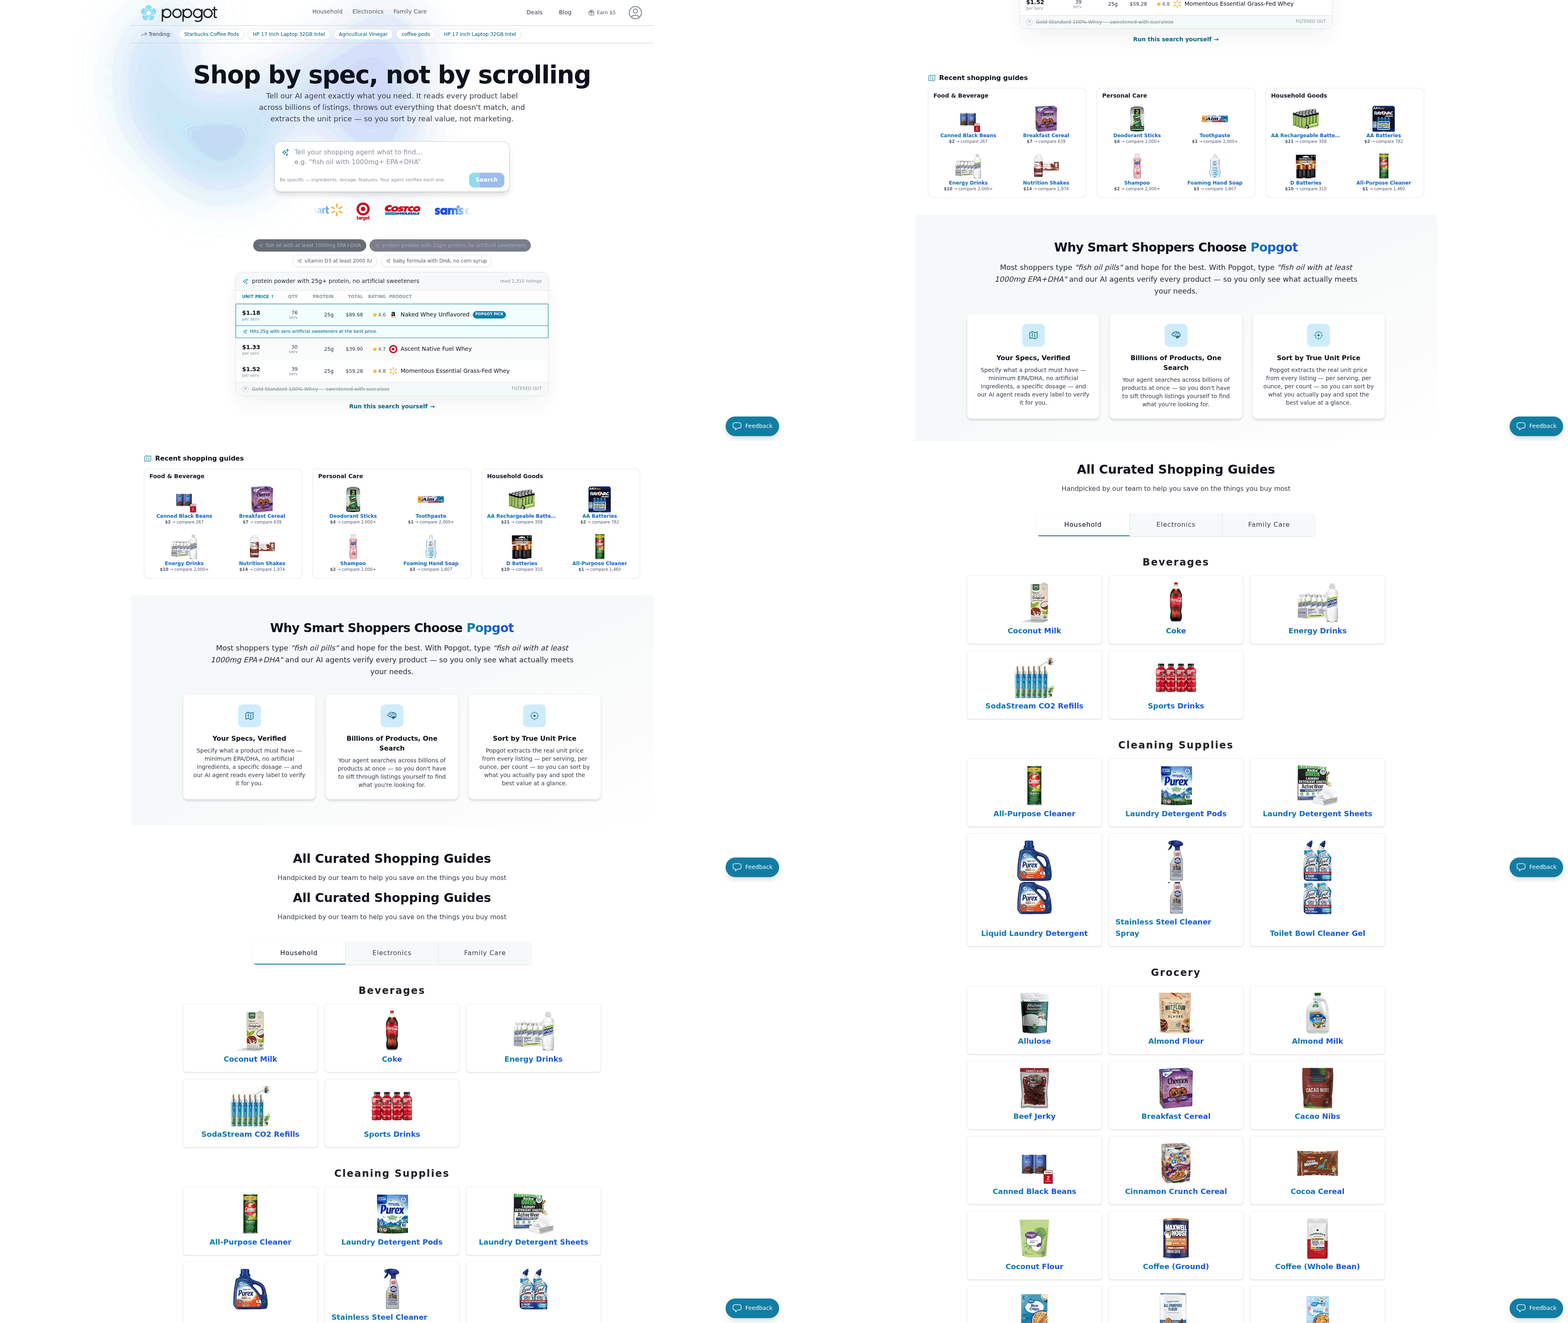
What Camelcamelcamel Tracks, and What It Misses
Camelcamelcamel tracks the historical price of an Amazon listing. It plots the price on a graph, flags a "Lowest Ever" mark, and lets you set alerts for a target number. For pure Amazon price history, it's good at its job.
The catch: it watches the dollar amount, not what's inside the package.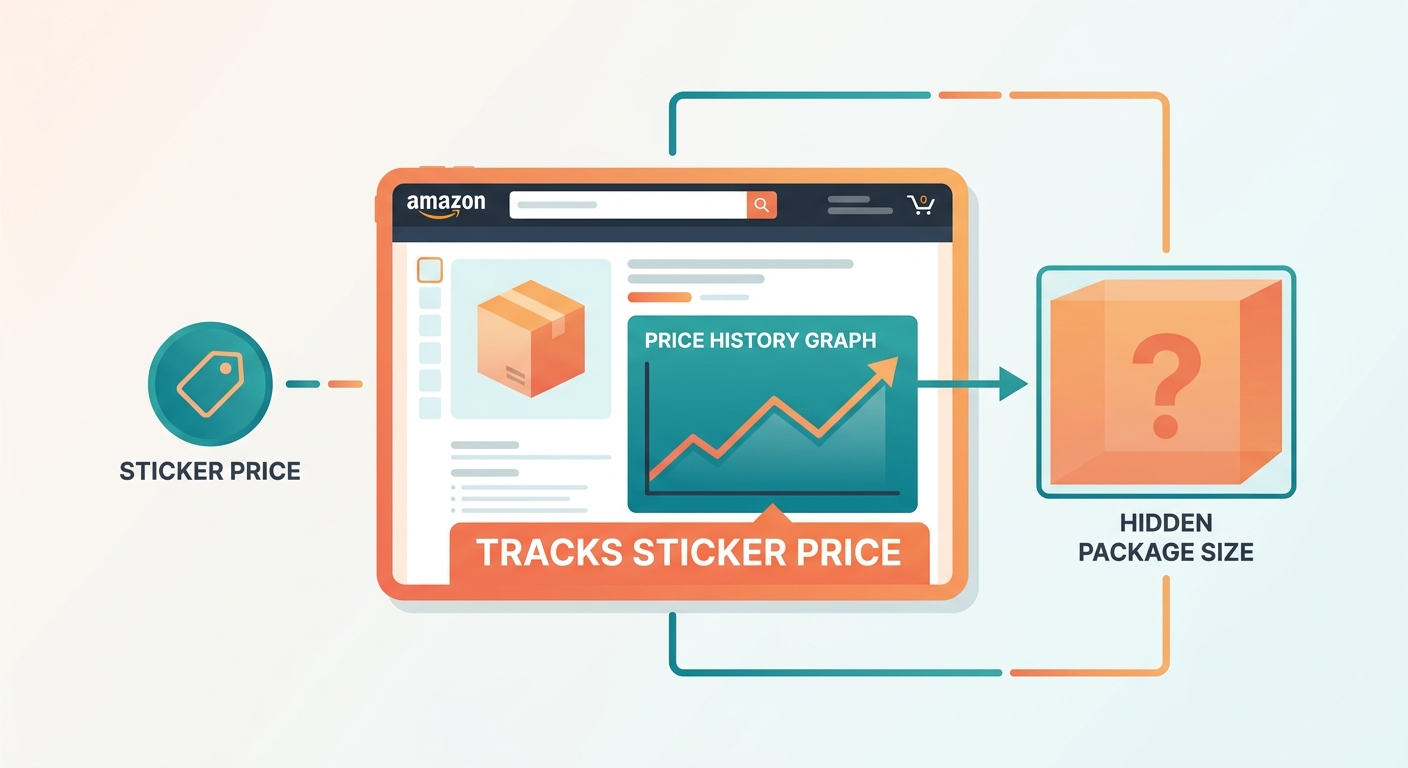
What it does well
Camelcamelcamel is built for one thing: the price attached to a single Amazon product page. It shows the highest, lowest, and average a listing has hit. Wondering whether $18 for a bottle of detergent is a real deal or an inflated one? The graph answers fast.
It also alerts you when a price falls. Set a threshold, get an email when the sticker drops. Genuinely useful for big-ticket items where the size doesn't change.
Where "Lowest Ever" breaks down
It breaks the moment a manufacturer shrinks the package. Camelcamelcamel keeps tracking the same product page with no idea the box went from 18 ounces to 15. The graph looks flat, even friendly. Your cost per ounce just jumped.
A coffee tub sits at $12 for a year, marked as a stable low. Then the fill drops from 30 ounces to 26. The graph never moves. You're paying 13 cents more per ounce, and the "Lowest Ever" badge is now lying to you.
Where unit pricing wins
This is the gap per-unit tracking fills. A tool that reads the actual size and calculates price per ounce, per serving, or per count catches the shrink the price graph misses. You compare what you truly pay, not the number on the tag.
Our Accurate Unit Pricing does exactly that: pull the real size from every listing and sort by cost per unit across retailers. When ounces drop, the unit price rises, and you see it plainly.
For anything sold by weight or count, skip a sticker-only tracker. It tells you half the truth.
References
[1] How to fight shrinkflation? Pay attention to unit prices at grocery stores - https://www.kuow.org/stories/how-to-fight-shrinkflation-pay-attention-to-unit-prices-at-grocery-stores
[2] How consumers respond to unit price increase tactics that ... - https://www.researchgate.net/publication/337929327_Cheaper_and_smaller_or_more_expensive_and_larger_How_consumers_respond_to_unit_price_increase_tactics_that_simultaneously_change_product_price_and_package_size
Frequently Asked Questions
1. Is shrinkflation legal, or are companies required to disclose package size reductions?
Shrinkflation is completely legal in the United States, as manufacturers aren't required to announce package reductions. They must accurately list net weight on the label, but no rule forces front-of-package warnings. This legal gap explains why checking the fine-print net weight remains your responsibility as a shopper.
2. How can I tell if a product shrank when I don't remember the old size?
Save receipts or photos of packaging, then compare net weights over time. Many stores display unit prices on shelf tags, letting you spot increases without recalling old sizes. Community-tracked databases and tools calculating price per ounce also flag reductions by exposing rising per-unit costs across months.
3. Does shrinkflation happen more during inflation or economic downturns?
Shrinkflation intensifies during high-inflation periods because raising sticker prices risks losing customers who anchor on familiar numbers. Shrinking packages lets companies preserve price points while offsetting rising ingredient, packaging, and shipping costs. During periods of high inflation, companies face soaring costs for raw ingredients, transportation, and packaging. Rather than raising the shelf price—which immediately alerts price-sensitive shoppers—manufacturers reduce the product volume to maintain their profit margins without triggering a drop in sales volume.
4. Can bulk or larger sizes protect me from shrinkflation?
Larger sizes often deliver lower cost per ounce, but this isn't guaranteed. Manufacturers sometimes shrink bulk packages too, and "family size" occasionally costs more per unit than standard boxes. Always compare the unit price across every size available, since bigger packaging doesn't automatically mean better value.
5. Why doesn't Camelcamelcamel just add unit pricing to its tracker?
Camelcamelcamel is built specifically for Amazon listing price history, plotting the dollar amount on a single product page over time. Extracting accurate package sizes across constantly changing listings requires different technology. Tracking unit prices programmatically is highly complex because online listings often format packaging sizes in inconsistent ways (e.g., 'Pack of 2,' '12 Fl Oz,' or '350g'). Specialized comparison engines solve this by using advanced data parsing to standardize these measurements, allowing shoppers to see a true, normalized cost per ounce across different retail platforms.
6. What products are least affected by shrinkflation?
Items sold by standardized weight or volume with strong regulation resist shrinkflation, like a gallon of milk or a dozen eggs, where quantity expectations are fixed. Instead, prices on these adjust openly. Processed snacks, personal care, and household goods with flexible packaging remain the most vulnerable categories.
7. How much money does shrinkflation actually cost the average shopper yearly?
Costs vary by household, but small per-unit increases compound significantly across regular rebuys. A few cents per ounce on coffee, snacks, soap, and paper products, purchased weekly, can quietly add dozens of dollars annually. Tracking per-unit cost on your three most-bought categories catches the largest leaks first.